使用说明:
-
运行要求:
- MATLAB R2020b 或更新版本
- 已安装 Deep Learning Toolbox
- 推荐使用GPU加速(训练时在代码开头添加
gpuDevice(1))
-
代码特点:
- 使用MATLAB自带的MNIST手写数字数据集
- 包含数据可视化、网络架构、训练曲线和混淆矩阵
- 最终测试准确率可达约98%
- 包含单张图片预测演示

%% 神经网络OCR识别示例(MATLAB 2020b及以上版本)
% 需要安装 Deep Learning Toolbox%% 步骤1:加载和预处理数据
clc; clear; close all% 加载MATLAB自带的手写数字数据集
digitDatasetPath = fullfile(matlabroot, 'toolbox', 'nnet', 'nndemos', ...'nndatasets', 'DigitDataset');
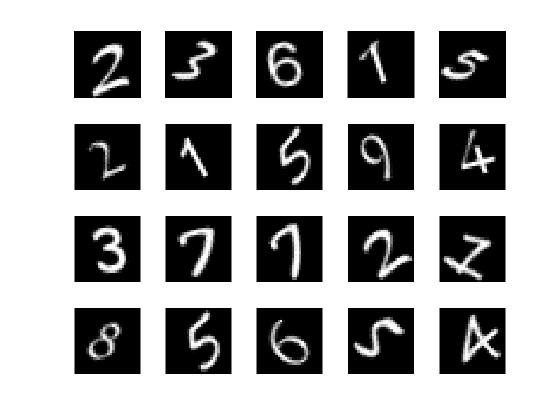
imds = imageDatastore(digitDatasetPath, ...'IncludeSubfolders', true, 'LabelSource', 'foldernames');% 显示部分样本
figure
numImages = 10000;
perm = randperm(numImages, 20);
for i = 1:20subplot(4,5,i);imshow(imds.Files{perm(i)});
end% 分割数据集(70%训练,30%测试)
[imdsTrain, imdsTest] = splitEachLabel(imds, 0.7, 'randomized');%% 步骤2:构建神经网络
inputSize = [28 28 1]; % 输入图像尺寸layers = [imageInputLayer(inputSize, 'Name', 'input') % 输入层convolution2dLayer(3, 16, 'Padding', 'same', 'Name', 'conv1') % 卷积层batchNormalizationLayer('Name', 'bn1')reluLayer('Name', 'relu1')maxPooling2dLayer(2, 'Stride', 2, 'Name', 'maxpool1') % 池化层convolution2dLayer(3, 32, 'Padding', 'same', 'Name', 'conv2')batchNormalizationLayer('Name', 'bn2')reluLayer('Name', 'relu2')fullyConnectedLayer(10, 'Name', 'fc') % 全连接层softmaxLayer('Name', 'softmax') % 分类层classificationLayer('Name', 'classification')];%% 步骤3:设置训练参数
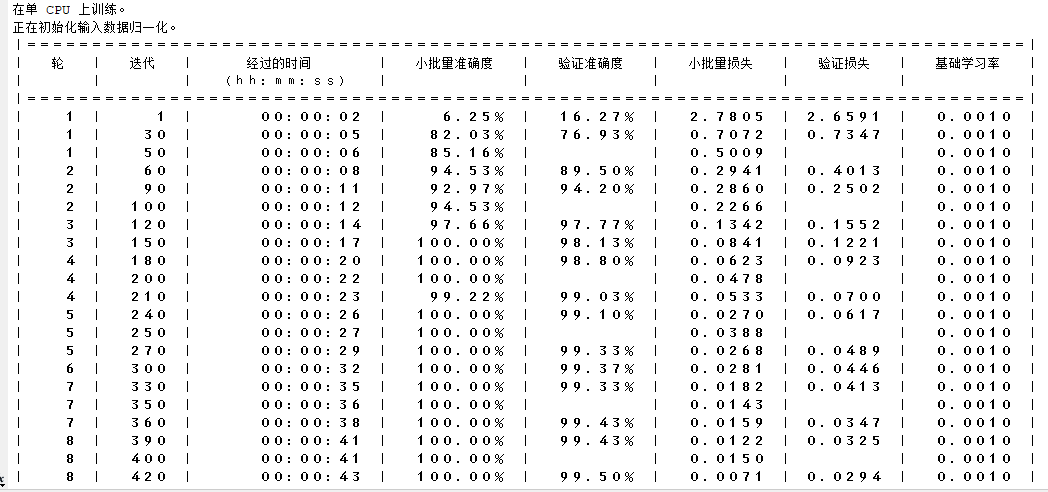
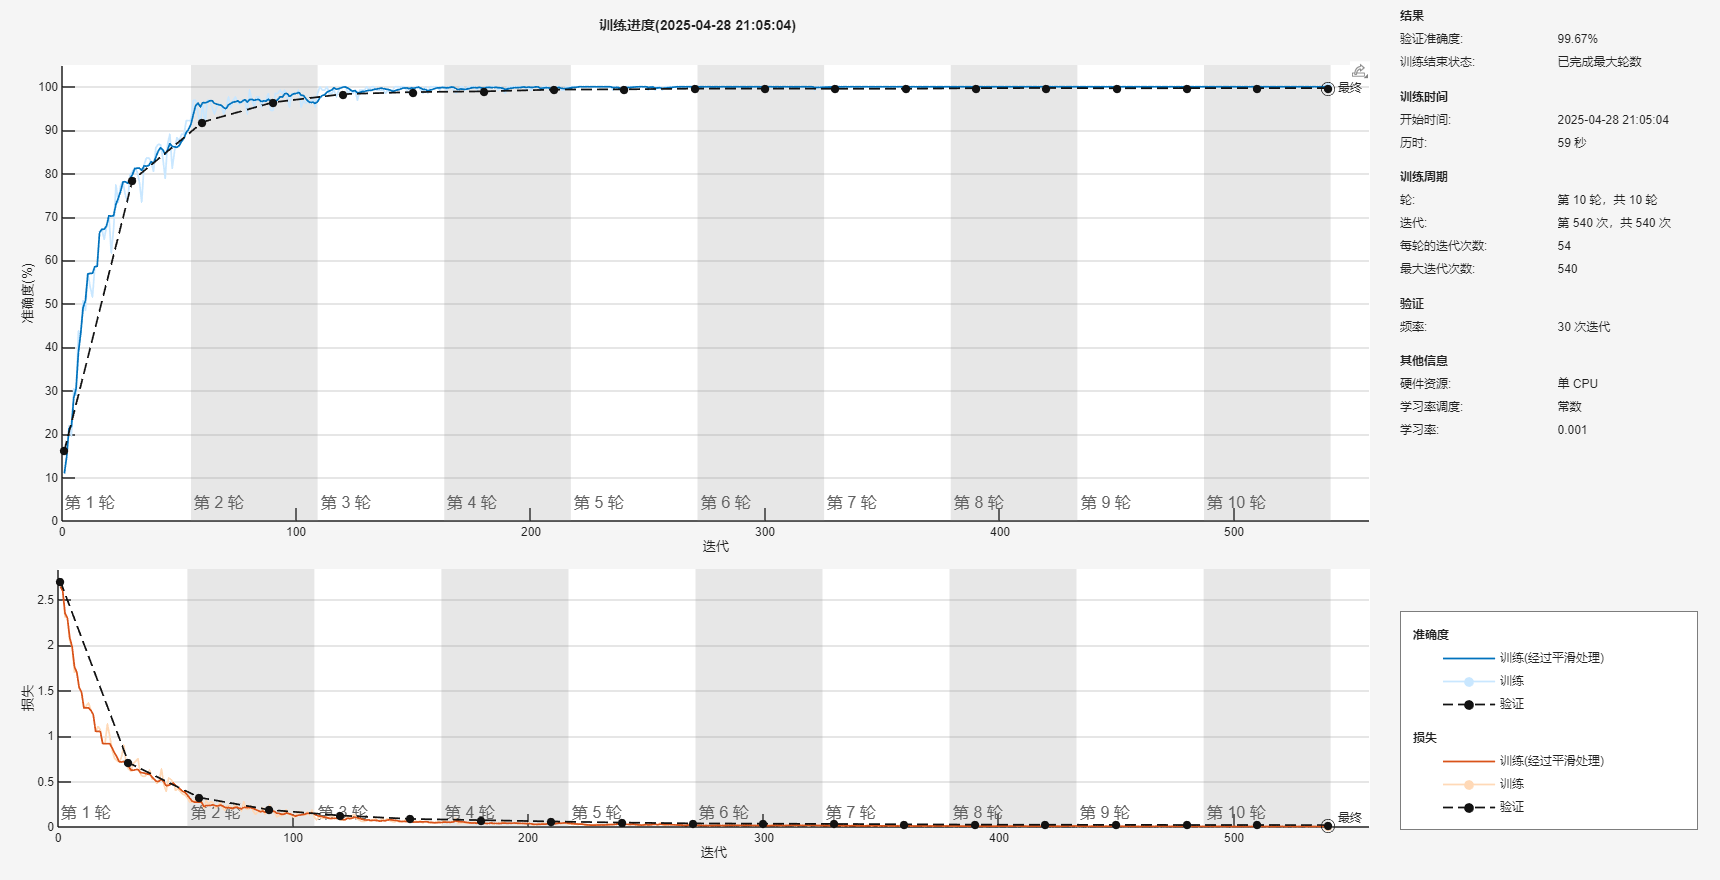
options = trainingOptions('adam', ...'InitialLearnRate', 0.001, ...'MaxEpochs', 10, ...'Shuffle', 'every-epoch', ...'ValidationData', imdsTest, ...'ValidationFrequency', 30, ...'Verbose', true, ...'Plots', 'training-progress');%% 步骤4:调整图像大小并训练网络
augimdsTrain = augmentedImageDatastore(inputSize(1:2), imdsTrain);
augimdsTest = augmentedImageDatastore(inputSize(1:2), imdsTest);net = trainNetwork(augimdsTrain, layers, options);%% 步骤5:测试网络性能
[YPred, probs] = classify(net, augimdsTest);
accuracy = mean(YPred == imdsTest.Labels);
disp(['测试准确率: ', num2str(accuracy*100), '%'])% 显示混淆矩阵
figure
confusionchart(imdsTest.Labels, YPred)%% 步骤6:单张图片测试示例
% 随机选取测试集中的一个图像
testImage = readimage(imdsTest, randi(numel(imdsTest.Files)));% 预处理并预测
inputImg = imresize(testImage, inputSize(1:2));
[result, scores] = classify(net, inputImg);% 显示结果
figure
imshow(testImage)
title(['预测结果: ' char(result), ' 真实标签: ' char(imdsTest.Labels(1))])
%% 神经网络OCR识别示例(MATLAB 2020b及以上版本)
% 需要安装 Deep Learning Toolbox%% 步骤1:加载和预处理数据
clc; clear; close all% 加载MATLAB自带的手写数字数据集
digitDatasetPath = fullfile(matlabroot, 'toolbox', 'nnet', 'nndemos', ...'nndatasets', 'DigitDataset');
imds = imageDatastore(digitDatasetPath, ...'IncludeSubfolders', true, 'LabelSource', 'foldernames');% 显示部分样本
figure
numImages = 10000;
perm = randperm(numImages, 20);
for i = 1:20subplot(4,5,i);imshow(imds.Files{perm(i)});
end% 分割数据集(70%训练,30%测试)
[imdsTrain, imdsTest] = splitEachLabel(imds, 0.7, 'randomized');%% 步骤2:构建神经网络
inputSize = [28 28 1]; % 输入图像尺寸layers = [imageInputLayer(inputSize, 'Name', 'input') % 输入层convolution2dLayer(3, 16, 'Padding', 'same', 'Name', 'conv1') % 卷积层batchNormalizationLayer('Name', 'bn1')reluLayer('Name', 'relu1')maxPooling2dLayer(2, 'Stride', 2, 'Name', 'maxpool1') % 池化层convolution2dLayer(3, 32, 'Padding', 'same', 'Name', 'conv2')batchNormalizationLayer('Name', 'bn2')reluLayer('Name', 'relu2')fullyConnectedLayer(10, 'Name', 'fc') % 全连接层softmaxLayer('Name', 'softmax') % 分类层classificationLayer('Name', 'classification')];%% 步骤3:设置训练参数
options = trainingOptions('adam', ...'InitialLearnRate', 0.001, ...'MaxEpochs', 10, ...'Shuffle', 'every-epoch', ...'ValidationData', imdsTest, ...'ValidationFrequency', 30, ...'Verbose', true, ...'Plots', 'training-progress');%% 步骤4:调整图像大小并训练网络
augimdsTrain = augmentedImageDatastore(inputSize(1:2), imdsTrain);
augimdsTest = augmentedImageDatastore(inputSize(1:2), imdsTest);net = trainNetwork(augimdsTrain, layers, options);%% 步骤5:测试网络性能
[YPred, probs] = classify(net, augimdsTest);
accuracy = mean(YPred == imdsTest.Labels);
disp(['测试准确率: ', num2str(accuracy*100), '%'])% 显示混淆矩阵
figure
confusionchart(imdsTest.Labels, YPred)%% 步骤6:单张图片测试示例
% 随机选取测试集中的一个图像
testImage = readimage(imdsTest, randi(numel(imdsTest.Files)));% 预处理并预测
inputImg = imresize(testImage, inputSize(1:2));
[result, scores] = classify(net, inputImg);% 显示结果
figure
imshow(testImage)
title(['预测结果: ' char(result), ' 真实标签: ' char(imdsTest.Labels(1))])