注意:本文是基于《go-zero(十八)结合Elasticsearch实现高效数据检索》这篇文章进行的,部分代码都是在这篇文章中实现,请先阅读这篇文章。
1. Prometheus和Grafana简介
1.1 为什么需要监控?
在微服务架构中,监控系统的运行状态至关重要。没有有效的监控,当系统出现问题时,我们可能无法及时发现并定位问题根源。对于搜索服务这类关键组件,监控尤为重要,因为它们通常是用户体验的重要环节。
1.2 Prometheus简介
Prometheus是一个开源的系统监控和告警工具包,最初由SoundCloud开发。它具有以下特点:
- 多维度数据模型:所有数据都以时间序列形式存储,具有相同指标名称和不同标签的时间序列代表不同的维度
- 强大的查询语言PromQL:可以对收集的时间序列数据进行切片和切块
- 无依赖存储:使用本地时间序列数据库,不依赖外部存储
- 基于HTTP的pull模式:通过HTTP协议从目标系统拉取指标数据
- 支持多种图形和仪表盘:可以与Grafana等工具集成,实现数据可视化
1.3 Grafana简介
Grafana是一个跨平台的开源分析和监控解决方案,提供以下功能:
- 丰富的可视化选项:支持多种图表类型,如折线图、柱状图、热图等
- 多数据源支持:可以连接Prometheus、Elasticsearch、MySQL等多种数据源
- 可交互的仪表盘:用户可以创建自定义的交互式仪表盘
- 告警功能:支持基于指标设置告警规则和通知渠道
- 用户权限控制:提供细粒度的用户权限管理
1.4 go-zero中的监控架构
go-zero框架内置了对指标监控的支持,主要通过以下组件实现:
- Prometheus集成:简化了指标的收集和暴露
- 指标中间件:自动收集HTTP请求、RPC调用等基础指标
- 自定义指标支持:允许开发者定义和收集业务特定指标
2. 环境部署
2.1 创建prometheus.yml
Prometheus通过配置文件定义监控目标和规则。我们需要创建一个配置文件来指定要抓取的go-zero应用指标。
环境依然使用docker部署,先创建 Prometheus 配置文件 prometheus.yml:
global:scrape_interval: 15s # 每15秒抓取一次指标evaluation_interval: 15s # 每15秒评估一次告警规则scrape_configs:- job_name: 'search-api'static_configs:- targets: ['host.docker.internal:9081']
prometheus.yml的位置自行修改,或者在docker-compose.yml所在目录下创建/deploy/prometheus/server/prometheus.yml
每15秒抓取一次指标
2.2 创建docker-compose.yml
创建 docker-compose.yml 文件,添加 Prometheus 和 Grafana:
version: '3'
services:#prometheus监控 — Prometheus for monitoringprometheus:image: bitnami/prometheus:latestcontainer_name: prometheusenvironment:TZ: Asia/Shanghai  # 简化环境变量格式volumes:- ./deploy/prometheus/server/prometheus.yml:/etc/prometheus/prometheus.yml- ./data/prometheus/data:/prometheuscommand:- '--config.file=/etc/prometheus/prometheus.yml'- '--storage.tsdb.path=/prometheus'restart: alwaysuser: root  # 非必要场景建议避免使用root用户ports:- 9090:9090networks:- go_zero_net#查看prometheus监控数据 - Grafana to view Prometheus monitoring datagrafana:image: grafana/grafana:latestcontainer_name: grafanaports:- "3000:3000"volumes:- grafana-storage:/var/lib/grafana- ./grafana/provisioning:/etc/grafana/provisioningenvironment:- GF_SECURITY_ADMIN_USER=admin- GF_SECURITY_ADMIN_PASSWORD=admin- GF_USERS_ALLOW_SIGN_UP=falsedepends_on:- prometheusrestart: alwaysextra_hosts:- "host.docker.internal:host-gateway"networks:- go_zero_netnetworks:go_zero_net:driver: bridge
启动服务:
docker-compose up -d
2.3 测试环境以及配置Grafana数据源
然后分别测试各服务是否正常:
浏览器打开 http://localhost:9090/query ,测试prometheus是否正常
浏览器打开 http://localhost:3000/ ,测试grafana是否正常,默认账号和密码是admin
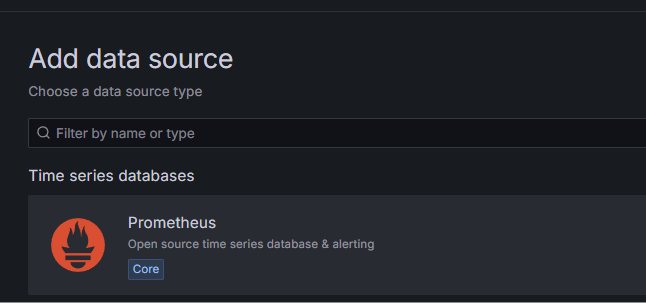
接下来我们配置下数据源 ,点击Data sources ,接着点击Add new data source

选择 prometheus
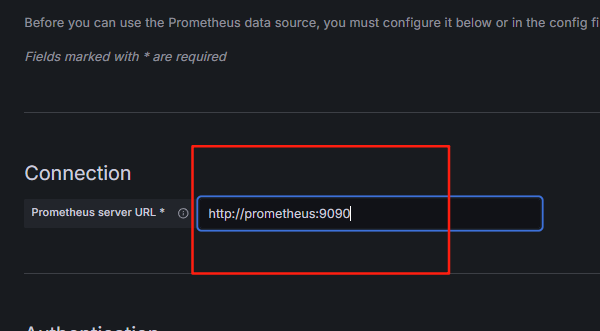
配置prometheus服务地址,如果是使用docker部署的,一般使用容器名作为主机名,使用http://prometheus:9090
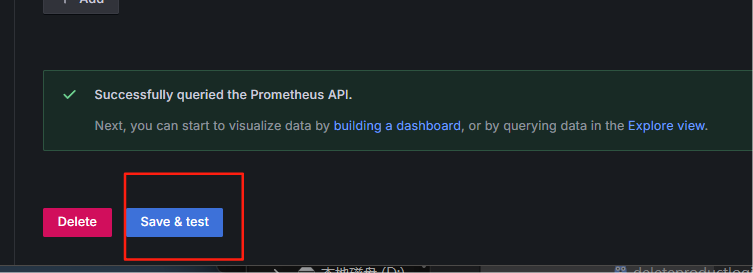
接着点击 Save & test ,如果出现Successfully 说明配置成功
3. 实现Prometheus指标监控
我们可以通过包装Elasticsearch客户端的HTTP Transport来自动收集所有ES请求的指标,而不是在每个业务逻辑中手动添加指标埋点
3.1 指标设计原则
在实现具体代码前,我们需要理解几个指标设计的核心原则:
- 明确的目标:每个指标应该有明确的监控目的
- 分层设计:系统级、应用级、业务级分层收集
- 适当粒度:既不过细导致数据过多,也不过粗导致缺乏洞察力
- 合理命名:命名规范清晰,包含服务/模块前缀
- 标签合理:使用标签增加维度,但避免标签值基数过高
针对Elasticsearch搜索服务,我们主要关注:
- 系统层:ES服务的可用性、集群状态
- 应用层:请求延迟、错误率、QPS
- 业务层:搜索命中率、索引操作成功率
3.2 metric指标定义
首先,创建 internal/pkg/metrics 目录,用于定义指标:
package metricsimport ("github.com/prometheus/client_golang/prometheus""github.com/zeromicro/go-zero/core/proc"
)// ES客户端请求指标
var (// ES请求耗时直方图ESClientReqDur = prometheus.NewHistogramVec(prometheus.HistogramOpts{Name:    "es_client_req_duration_ms",Help:    "Elasticsearch client requests duration in milliseconds",Buckets: []float64{5, 10, 25, 50, 100, 250, 500, 1000, 2500, 5000}, // 分桶},[]string{"index"}, // 索引名称标签)// ES请求错误计数器ESClientReqErrTotal = prometheus.NewCounterVec(prometheus.CounterOpts{Name: "es_client_req_err_total",Help: "Elasticsearch client request error count",},[]string{"index", "error"}, // 索引名称和错误标签)// ES请求计数器ESClientReqTotal = prometheus.NewCounterVec(prometheus.CounterOpts{Name: "es_client_req_total",Help: "Elasticsearch client request total count",},[]string{"index", "method"}, // 索引名称和HTTP方法标签)// 搜索请求计数器SearchRequests = prometheus.NewCounterVec(prometheus.CounterOpts{Name: "search_requests_total",Help: "Total number of search requests",},[]string{"status"}, // 标签:成功/失败)// 索引操作计数器IndexOperations = prometheus.NewCounterVec(prometheus.CounterOpts{Name: "index_operations_total",Help: "Total number of index operations",},[]string{"operation", "status"}, // 标签:操作类型(add/delete),状态(success/error))
)// RegisterMetrics 注册所有指标
func RegisterMetrics() {prometheus.MustRegister(ESClientReqDur,ESClientReqErrTotal,ESClientReqTotal,SearchRequests,IndexOperations,)// 在程序结束时确保指标被正确释放proc.AddShutdownListener(func() {prometheus.Unregister(ESClientReqDur)prometheus.Unregister(ESClientReqErrTotal)prometheus.Unregister(ESClientReqTotal)prometheus.Unregister(SearchRequests)prometheus.Unregister(IndexOperations)})
}
3.3 自定义Transport
现在,创建一个支持指标监控的 Elasticsearch 客户端包装器。创建 internal/pkg/es/metric_transport.go 文件:
package esimport ("go-zero-demo/ES/internal/pkg/metrics""net/http""strconv""strings""time"
)// MetricTransport 是一个包装http.RoundTripper的结构体,用于收集ES请求指标
type MetricTransport struct {transport http.RoundTripper
}// NewMetricTransport 创建一个新的MetricTransport
func NewMetricTransport(transport http.RoundTripper) *MetricTransport {if transport == nil {transport = http.DefaultTransport}return &MetricTransport{transport: transport}
}// RoundTrip 实现http.RoundTripper接口,添加指标收集
func (t *MetricTransport) RoundTrip(req *http.Request) (resp *http.Response, err error) {var (startTime = time.Now()// 尝试从请求URL中提取索引名称indexName = extractIndexName(req.URL.Path)method    = req.Method)// 增加请求计数metrics.ESClientReqTotal.WithLabelValues(indexName, method).Inc()// 执行原始请求resp, err = t.transport.RoundTrip(req)// 记录请求耗时metrics.ESClientReqDur.WithLabelValues(indexName).Observe(float64(time.Since(startTime).Milliseconds()))// 记录错误metrics.ESClientReqErrTotal.WithLabelValues(indexName, strconv.FormatBool(err != nil)).Inc()return resp, err
}// extractIndexName 从请求路径中提取Elasticsearch索引名称func extractIndexName(path string) string {// 移除前导斜杠if path[0] == '/' {path = path[1:]}// 提取第一个路径段作为索引名parts := strings.SplitN(path, "/", 2)if len(parts) == 0 {return "unknown"}// 检查是否是特殊API路径if parts[0] == "_cat" || parts[0] == "_cluster" || parts[0] == "_nodes" || parts[0] == "_search" || parts[0] == "_bulk" || parts[0] == "_msearch" {return parts[0]}// 移除可能出现在索引名称中的查询字符串index := strings.Split(parts[0], "?")[0]if index == "" {return "unknown"}return index
}
修改 internal/pkg/es/es.go 中的 NewElasticsearchClient 方法,使用我们的指标收集包装器:
func NewElasticsearchClient(addresses []string, username, password string) (*ElasticsearchClient, error) {// 创建基础 TransportbaseTransport := &http.Transport{MaxIdleConnsPerHost:   10,ResponseHeaderTimeout: 5 * time.Second,DialContext:           (&net.Dialer{Timeout: 5 * time.Second}).DialContext,TLSClientConfig: &tls.Config{MinVersion: tls.VersionTLS12,},}// 使用指标包装器包装基础 TransportmetricTransport := NewMetricTransport(baseTransport)cfg := elasticsearch.Config{Addresses: addresses,Username:  username,Password:  password,Transport: metricTransport, // 使用包装后的 Transport}client, err := elasticsearch.NewClient(cfg)if err != nil {return nil, err}// 测试连接res, err := client.Info()if err != nil {return nil, err}defer res.Body.Close()if res.IsError() {return nil, errors.New("Elasticsearch connection failed")}return &ElasticsearchClient{client: client,}, nil
}
3.4 注册指标
修改 search.go 文件,注册指标:
func main() {flag.Parse()var c config.Configconf.MustLoad(*configFile, &c)// 启用 Prometheus 指标prometheus.StartAgent(c.Prometheus)metrics.RegisterMetrics()//其他代码不变server := rest.MustNewServer(c.RestConf)defer server.Stop()ctx := svc.NewServiceContext(c)// 初始化 Elasticsearch 索引if err := svc.InitElasticsearch(ctx.EsClient); err != nil {panic(fmt.Sprintf("初始化 Elasticsearch 失败: %v", err))}handler.RegisterHandlers(server, ctx)fmt.Printf("Starting server at %s:%d...\n", c.Host, c.Port)server.Start()
}
3.5 修改配置文件
在 etc/search-api.yaml 中添加 Prometheus 配置:
Name: search-api
Host: 0.0.0.0
Port: 8888Elasticsearch:Addresses:- http://localhost:9200Username: ""Password: ""# 添加 Prometheus 指标配置
Prometheus:Host: 0.0.0.0Port: 9091Path: /metrics
3.6 完善业务层指标收集
尽管我们已经通过Transport层获取了Elasticsearch操作的底层指标,但在业务层面添加更多语义化的指标仍然很有价值。修改 internal/logic/searchproductslogic.go 文件:
func (l *SearchProductsLogic) SearchProducts(req *types.SearchRequest) (resp *types.SearchResponse, err error) {// 记录业务层面的搜索请求defer func() {if err != nil {metrics.SearchRequests.WithLabelValues("error").Inc()} else {metrics.SearchRequests.WithLabelValues("success").Inc()}}()// 现有逻辑保持不变// ...
}
修改 internal/logic/indexproductlogic.go 文件:
func (l *IndexProductLogic) IndexProduct(req *types.IndexProductRequest) (resp *types.IndexProductResponse, err error) {// 记录业务层面的索引操作defer func() {if err != nil {metrics.IndexOperations.WithLabelValues("add", "error").Inc()} else {metrics.IndexOperations.WithLabelValues("add", "success").Inc()}}()// 现有逻辑保持不变// ...
}
修改 internal/logic/deleteproductlogic.go 文件:
func (l *DeleteProductLogic) DeleteProduct(productId string) (resp *types.IndexProductResponse, err error) {// 记录业务层面的删除操作defer func() {if err != nil {metrics.IndexOperations.WithLabelValues("delete", "error").Inc()} else {metrics.IndexOperations.WithLabelValues("delete", "success").Inc()}}()// 现有逻辑保持不变// ...
}
4. 运行测试
go run search.go
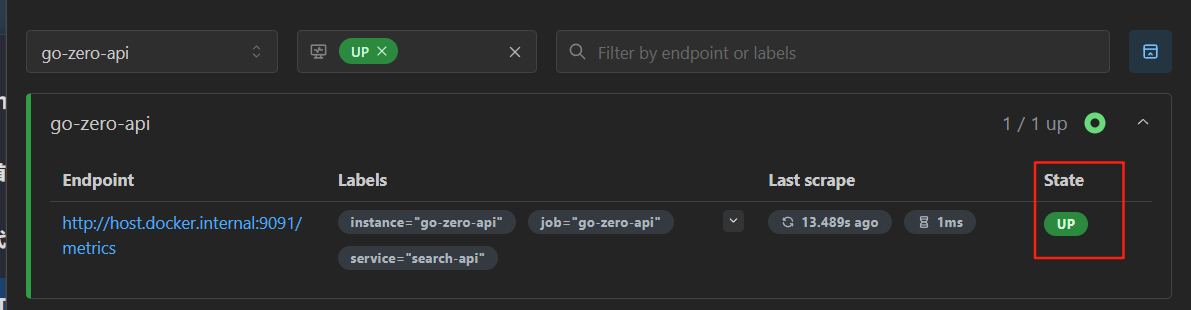
项目运行后,浏览器打开http://localhost:9090 ,然后点击Status ->Target health,看下服务状态是否正常,如果是UP说明项目的Prometheus已经正常启动.
接着可以把每个API测试一遍,这里我就不演示了
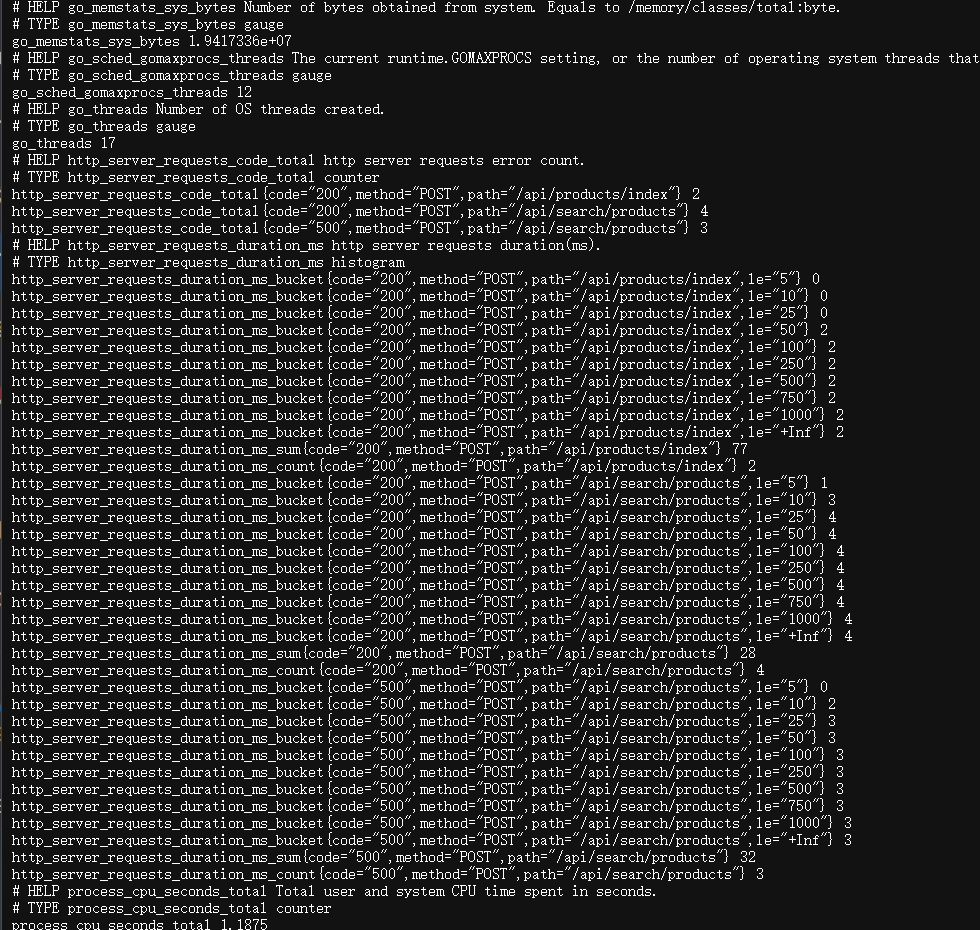
api测试完成后,浏览器访问http://127.0.0.1:9091/metrics ,看下指标是否被监控,如果有以下类似的数据,说明指标已经被监控。
5. 创建 Grafana 仪表盘
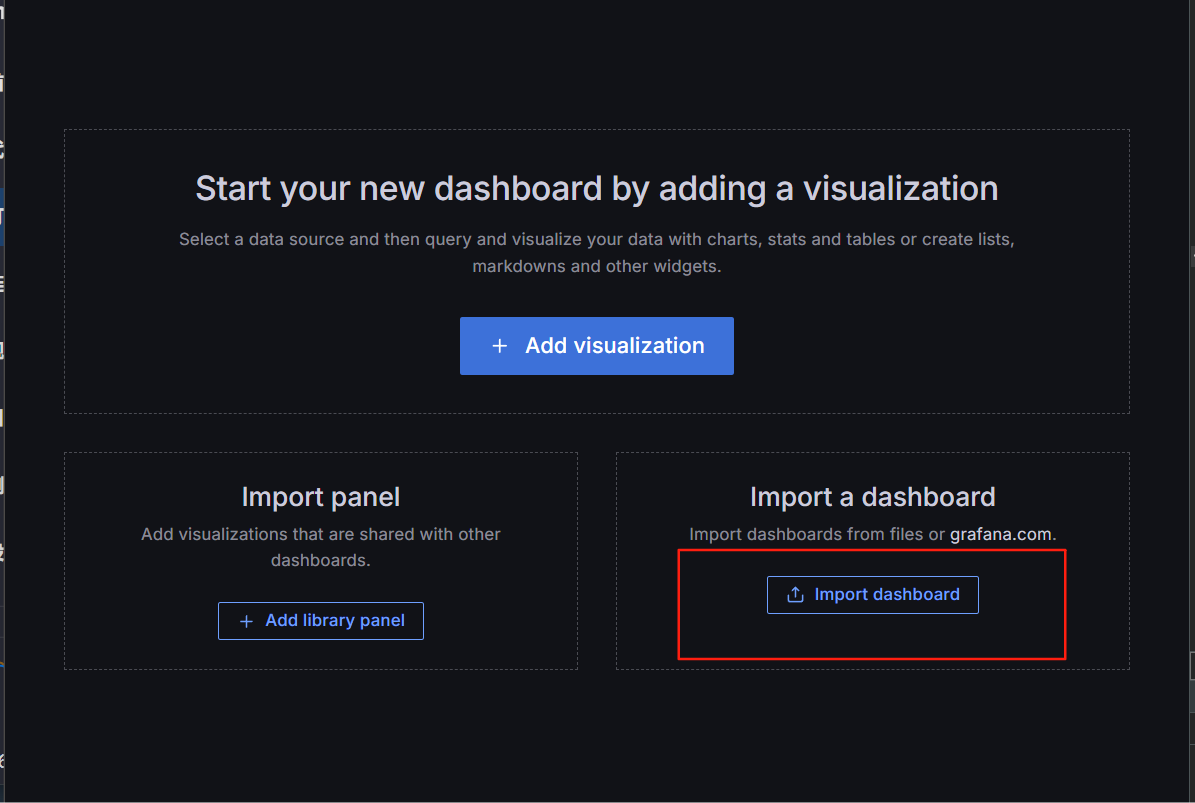
为了让指标看上去更直观,我们需要使用Grafana 让数据可视化,浏览器打开http://localhost:3000, 点击Dashboards ,接着点击Create dashboard ,然后点击 Import dashboard
接着在这里粘贴下面的json,点击Load,即可
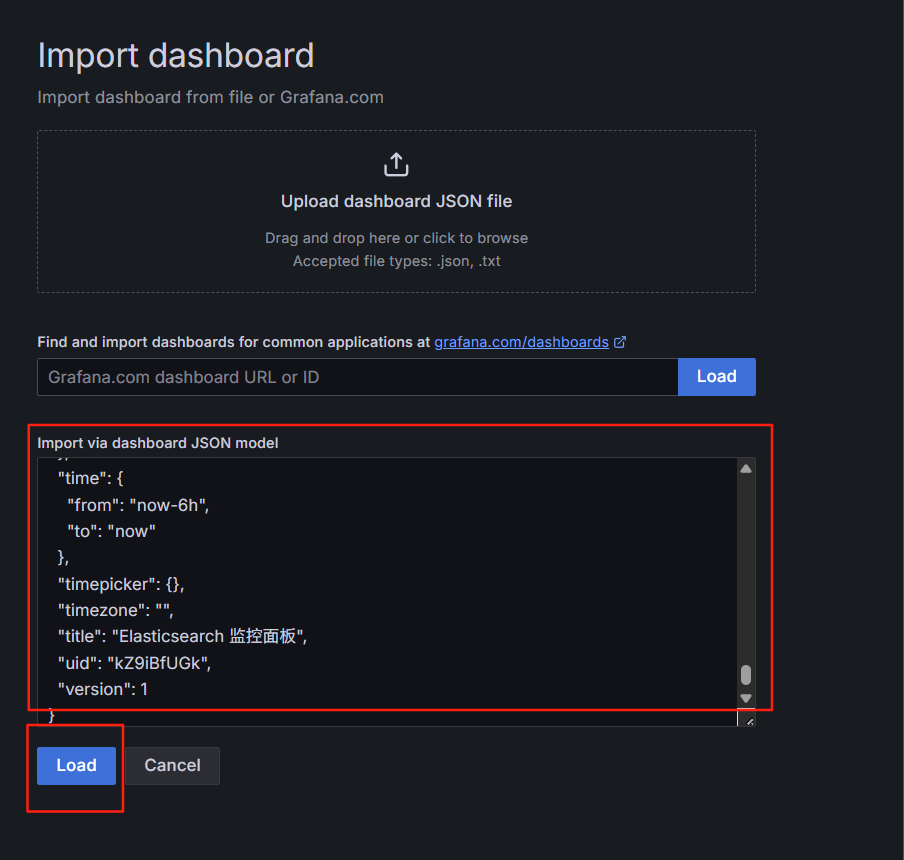
以下是 Grafana 仪表盘的 JSON 定义示例,可以导入到 Grafana 中:
{"annotations": {"list": [{"builtIn": 1,"datasource": "-- Grafana --","enable": true,"hide": true,"iconColor": "rgba(0, 211, 255, 1)","name": "Annotations & Alerts","type": "dashboard"}]},"editable": true,"gnetId": null,"graphTooltip": 0,"id": 1,"links": [],"panels": [{"aliasColors": {},"bars": false,"dashLength": 10,"dashes": false,"datasource": "Prometheus","fieldConfig": {"defaults": {"custom": {}},"overrides": []},"fill": 1,"fillGradient": 0,"gridPos": {"h": 8,"w": 12,"x": 0,"y": 0},"hiddenSeries": false,"id": 2,"legend": {"avg": false,"current": false,"max": false,"min": false,"show": true,"total": false,"values": false},"lines": true,"linewidth": 1,"nullPointMode": "null","options": {"alertThreshold": true},"percentage": false,"pluginVersion": "7.2.0","pointradius": 2,"points": false,"renderer": "flot","seriesOverrides": [],"spaceLength": 10,"stack": false,"steppedLine": false,"targets": [{"expr": "es_client_req_duration_ms_sum / es_client_req_duration_ms_count","interval": "","legendFormat": "{{index}}","refId": "A"}],"thresholds": [],"timeFrom": null,"timeRegions": [],"timeShift": null,"title": "Elasticsearch 平均请求耗时 (ms)","tooltip": {"shared": true,"sort": 0,"value_type": "individual"},"type": "graph","xaxis": {"buckets": null,"mode": "time","name": null,"show": true,"values": []},"yaxes": [{"format": "ms","label": null,"logBase": 1,"max": null,"min": null,"show": true},{"format": "short","label": null,"logBase": 1,"max": null,"min": null,"show": true}],"yaxis": {"align": false,"alignLevel": null}},{"aliasColors": {},"bars": false,"dashLength": 10,"dashes": false,"datasource": "Prometheus","fieldConfig": {"defaults": {"custom": {}},"overrides": []},"fill": 1,"fillGradient": 0,"gridPos": {"h": 8,"w": 12,"x": 12,"y": 0},"hiddenSeries": false,"id": 4,"legend": {"avg": false,"current": false,"max": false,"min": false,"show": true,"total": false,"values": false},"lines": true,"linewidth": 1,"nullPointMode": "null","options": {"alertThreshold": true},"percentage": false,"pluginVersion": "7.2.0","pointradius": 2,"points": false,"renderer": "flot","seriesOverrides": [],"spaceLength": 10,"stack": false,"steppedLine": false,"targets": [{"expr": "rate(es_client_req_total[1m])","interval": "","legendFormat": "{{index}} - {{method}}","refId": "A"}],"thresholds": [],"timeFrom": null,"timeRegions": [],"timeShift": null,"title": "Elasticsearch 请求速率 (每分钟)","tooltip": {"shared": true,"sort": 0,"value_type": "individual"},"type": "graph","xaxis": {"buckets": null,"mode": "time","name": null,"show": true,"values": []},"yaxes": [{"format": "short","label": null,"logBase": 1,"max": null,"min": null,"show": true},{"format": "short","label": null,"logBase": 1,"max": null,"min": null,"show": true}],"yaxis": {"align": false,"alignLevel": null}},{"aliasColors": {},"bars": false,"dashLength": 10,"dashes": false,"datasource": "Prometheus","fieldConfig": {"defaults": {"custom": {}},"overrides": []},"fill": 1,"fillGradient": 0,"gridPos": {"h": 8,"w": 12,"x": 0,"y": 8},"hiddenSeries": false,"id": 6,"legend": {"avg": false,"current": false,"max": false,"min": false,"show": true,"total": false,"values": false},"lines": true,"linewidth": 1,"nullPointMode": "null","options": {"alertThreshold": true},"percentage": false,"pluginVersion": "7.2.0","pointradius": 2,"points": false,"renderer": "flot","seriesOverrides": [],"spaceLength": 10,"stack": false,"steppedLine": false,"targets": [{"expr": "rate(es_client_req_err_total{error=\"true\"}[1m])","interval": "","legendFormat": "{{index}}","refId": "A"}],"thresholds": [],"timeFrom": null,"timeRegions": [],"timeShift": null,"title": "Elasticsearch 错误速率 (每分钟)","tooltip": {"shared": true,"sort": 0,"value_type": "individual"},"type": "graph","xaxis": {"buckets": null,"mode": "time","name": null,"show": true,"values": []},"yaxes": [{"format": "short","label": null,"logBase": 1,"max": null,"min": null,"show": true},{"format": "short","label": null,"logBase": 1,"max": null,"min": null,"show": true}],"yaxis": {"align": false,"alignLevel": null}},{"aliasColors": {},"bars": false,"dashLength": 10,"dashes": false,"datasource": "Prometheus","fieldConfig": {"defaults": {"custom": {}},"overrides": []},"fill": 1,"fillGradient": 0,"gridPos": {"h": 8,"w": 12,"x": 12,"y": 8},"hiddenSeries": false,"id": 8,"legend": {"avg": false,"current": false,"max": false,"min": false,"show": true,"total": false,"values": false},"lines": true,"linewidth": 1,"nullPointMode": "null","options": {"alertThreshold": true},"percentage": false,"pluginVersion": "7.2.0","pointradius": 2,"points": false,"renderer": "flot","seriesOverrides": [],"spaceLength": 10,"stack": false,"steppedLine": false,"targets": [{"expr": "rate(search_requests_total[1m])","interval": "","legendFormat": "{{status}}","refId": "A"}],"thresholds": [],"timeFrom": null,"timeRegions": [],"timeShift": null,"title": "搜索请求速率 (每分钟)","tooltip": {"shared": true,"sort": 0,"value_type": "individual"},"type": "graph","xaxis": {"buckets": null,"mode": "time","name": null,"show": true,"values": []},"yaxes": [{"format": "short","label": null,"logBase": 1,"max": null,"min": null,"show": true},{"format": "short","label": null,"logBase": 1,"max": null,"min": null,"show": true}],"yaxis": {"align": false,"alignLevel": null}},{"aliasColors": {},"bars": false,"dashLength": 10,"dashes": false,"datasource": "Prometheus","fieldConfig": {"defaults": {"custom": {}},"overrides": []},"fill": 1,"fillGradient": 0,"gridPos": {"h": 8,"w": 12,"x": 0,"y": 16},"hiddenSeries": false,"id": 10,"legend": {"avg": false,"current": false,"max": false,"min": false,"show": true,"total": false,"values": false},"lines": true,"linewidth": 1,"nullPointMode": "null","options": {"alertThreshold": true},"percentage": false,"pluginVersion": "7.2.0","pointradius": 2,"points": false,"renderer": "flot","seriesOverrides": [],"spaceLength": 10,"stack": false,"steppedLine": false,"targets": [{"expr": "rate(index_operations_total[1m])","interval": "","legendFormat": "{{operation}} - {{status}}","refId": "A"}],"thresholds": [],"timeFrom": null,"timeRegions": [],"timeShift": null,"title": "索引操作速率 (每分钟)","tooltip": {"shared": true,"sort": 0,"value_type": "individual"},"type": "graph","xaxis": {"buckets": null,"mode": "time","name": null,"show": true,"values": []},"yaxes": [{"format": "short","label": null,"logBase": 1,"max": null,"min": null,"show": true},{"format": "short","label": null,"logBase": 1,"max": null,"min": null,"show": true}],"yaxis": {"align": false,"alignLevel": null}},{"aliasColors": {},"bars": false,"dashLength": 10,"dashes": false,"datasource": "Prometheus","description": "","fieldConfig": {"defaults": {"custom": {}},"overrides": []},"fill": 1,"fillGradient": 0,"gridPos": {"h": 8,"w": 12,"x": 12,"y": 16},"hiddenSeries": false,"id": 12,"legend": {"avg": false,"current": false,"max": false,"min": false,"show": true,"total": false,"values": false},"lines": true,"linewidth": 1,"nullPointMode": "null","options": {"alertThreshold": true},"percentage": false,"pluginVersion": "7.2.0","pointradius": 2,"points": false,"renderer": "flot","seriesOverrides": [],"spaceLength": 10,"stack": false,"steppedLine": false,"targets": [{"expr": "histogram_quantile(0.95, sum(rate(es_client_req_duration_ms_bucket[5m])) by (le, index))","interval": "","legendFormat": "p95 - {{index}}","refId": "A"},{"expr": "histogram_quantile(0.99, sum(rate(es_client_req_duration_ms_bucket[5m])) by (le, index))","interval": "","legendFormat": "p99 - {{index}}","refId": "B"}],"thresholds": [],"timeFrom": null,"timeRegions": [],"timeShift": null,"title": "Elasticsearch 请求耗时分位数 (ms)","tooltip": {"shared": true,"sort": 0,"value_type": "individual"},"type": "graph","xaxis": {"buckets": null,"mode": "time","name": null,"show": true,"values": []},"yaxes": [{"format": "ms","label": null,"logBase": 1,"max": null,"min": null,"show": true},{"format": "short","label": null,"logBase": 1,"max": null,"min": null,"show": true}],"yaxis": {"align": false,"alignLevel": null}}],"refresh": "10s","schemaVersion": 26,"style": "dark","tags": [],"templating": {"list": []},"time": {"from": "now-6h","to": "now"},"timepicker": {},"timezone": "","title": "Elasticsearch 监控面板","uid": "kZ9iBfUGk","version": 1
}
导入Json后,会生成如下的界面:

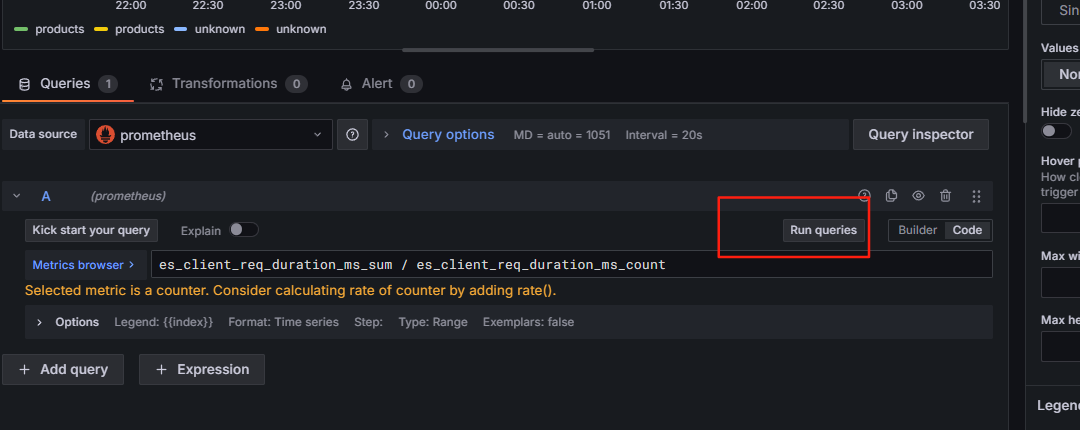
如果数据都是显示No data , 点击每一个选项卡,然后点击 Edit
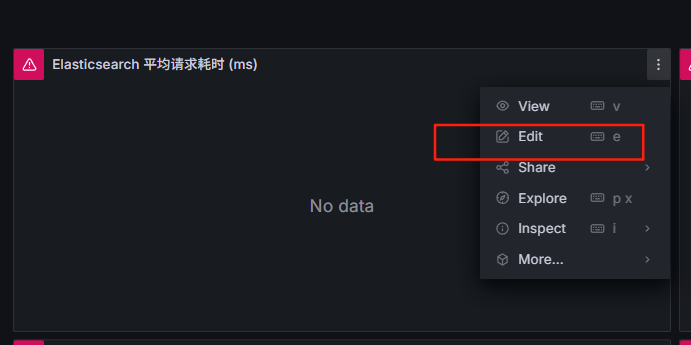
接着手动点击Run queries ,就会出现数据, 然后点击Save dashboard 保存即可。


?)
![[C#] Winform - 进程间通信(SendMessage篇)](http://pic.xiahunao.cn/nshx/[C#] Winform - 进程间通信(SendMessage篇))

