以下是使用OpenLayers根据任意数量控制点绘制贝塞尔曲线的完整实现方案。该方案支持三个及以上控制点,使用递归算法计算高阶贝塞尔曲线。
实现思路
- 贝塞尔曲线原理:使用德卡斯特里奥算法(De Casteljau’s Algorithm)递归计算任意阶贝塞尔曲线。
- 坐标转换:将WGS 84经纬度点转换为Web Mercator投影(EPSG:3857)。
- 曲线计算:通过递归算法计算曲线上的多个点,形成平滑曲线。
- 地图渲染:使用OpenLayers的
LineString几何对象绘制曲线。
代码实现
<!DOCTYPE html>
<html lang="zh-CN">
<head><meta charset="UTF-8"><title>OpenLayers多控制点贝塞尔曲线</title><script src="https://cdn.jsdelivr.net/npm/ol@7.3.0/dist/ol.js"></script><link href="https://cdn.jsdelivr.net/npm/ol@7.3.0/ol.css" rel="stylesheet"><style>.map {width: 100%;height: 400px;}</style>
</head>
<body><div id="map" class="map"></div><script>// 1. 定义多个控制点(经纬度坐标)const controlPoints = [[116.3, 39.9],    // 北京[118.0, 37.5],    // 黄海海域[121.0, 35.0],    // 东海海域[122.0, 32.0],    // 控制点[121.4, 31.2]     // 上海];// 2. 经纬度转Web Mercator投影const transformPoints = (points) => {return points.map(point => ol.proj.transform(point, 'EPSG:4326', 'EPSG:3857'));};// 3. 递归计算贝塞尔曲线上的点(德卡斯特里奥算法)function deCasteljau(points, t) {if (points.length === 1) return points[0];const newPoints = [];for (let i = 0; i < points.length - 1; i++) {const x = (1 - t) * points[i][0] + t * points[i + 1][0];const y = (1 - t) * points[i][1] + t * points[i + 1][1];newPoints.push([x, y]);}return deCasteljau(newPoints, t);}// 4. 计算完整贝塞尔曲线function calculateBezierCurve(points, segments = 50) {const curvePoints = [];for (let t = 0; t <= 1; t += 1 / segments) {curvePoints.push(deCasteljau(points, t));}return curvePoints;}// 5. 转换坐标并计算贝塞尔曲线const mercatorPoints = transformPoints(controlPoints);const bezierPoints = calculateBezierCurve(mercatorPoints, 100);// 6. 创建地图const map = new ol.Map({target: 'map',layers: [new ol.layer.Tile({source: new ol.source.OSM()})],view: new ol.View({center: ol.proj.transform([119, 34], 'EPSG:4326', 'EPSG:3857'),zoom: 5})});// 7. 创建贝塞尔曲线要素const bezierCurve = new ol.geom.LineString(bezierPoints);const feature = new ol.Feature({geometry: bezierCurve,name: '贝塞尔曲线'});// 8. 设置曲线样式feature.setStyle(new ol.style.Style({stroke: new ol.style.Stroke({color: 'rgba(255, 0, 0, 0.8)',width: 3,lineDash: [10, 5]})}));// 9. 添加曲线到地图const vectorSource = new ol.source.Vector({features: [feature]});const vectorLayer = new ol.layer.Vector({source: vectorSource});map.addLayer(vectorLayer);// 10. 添加控制点标记controlPoints.forEach((point, index) => {const mercatorPoint = ol.proj.transform(point, 'EPSG:4326', 'EPSG:3857');const marker = new ol.Feature({geometry: new ol.geom.Point(mercatorPoint),name: `控制点${index + 1}`});marker.setStyle(new ol.style.Style({image: new ol.style.Circle({radius: 6,fill: new ol.style.Fill({ color: 'blue' }),stroke: new ol.style.Stroke({ color: 'white', width: 2 })}),text: new ol.style.Text({text: `控制点${index + 1}`,font: '14px Arial',fill: new ol.style.Fill({ color: 'black' }),stroke: new ol.style.Stroke({ color: 'white', width: 2 }),offsetY: -10})}));vectorSource.addFeature(marker);});</script>
</body>
</html>
核心代码解析
-
德卡斯特里奥算法:
- 递归计算贝塞尔曲线上的点,支持任意数量的控制点
- 公式:( B(t) = (1-t)B_{0}^{n-1}(t) + tB_{1}^{n-1}(t) )
- 时间复杂度:( O(n^2) ),n为控制点数量
-
坐标转换:
- 使用
ol.proj.transform()确保所有点在同一投影系统下
- 使用
-
曲线精度控制:
segments参数控制曲线的平滑度,值越大曲线越平滑但性能开销更高
效果展示
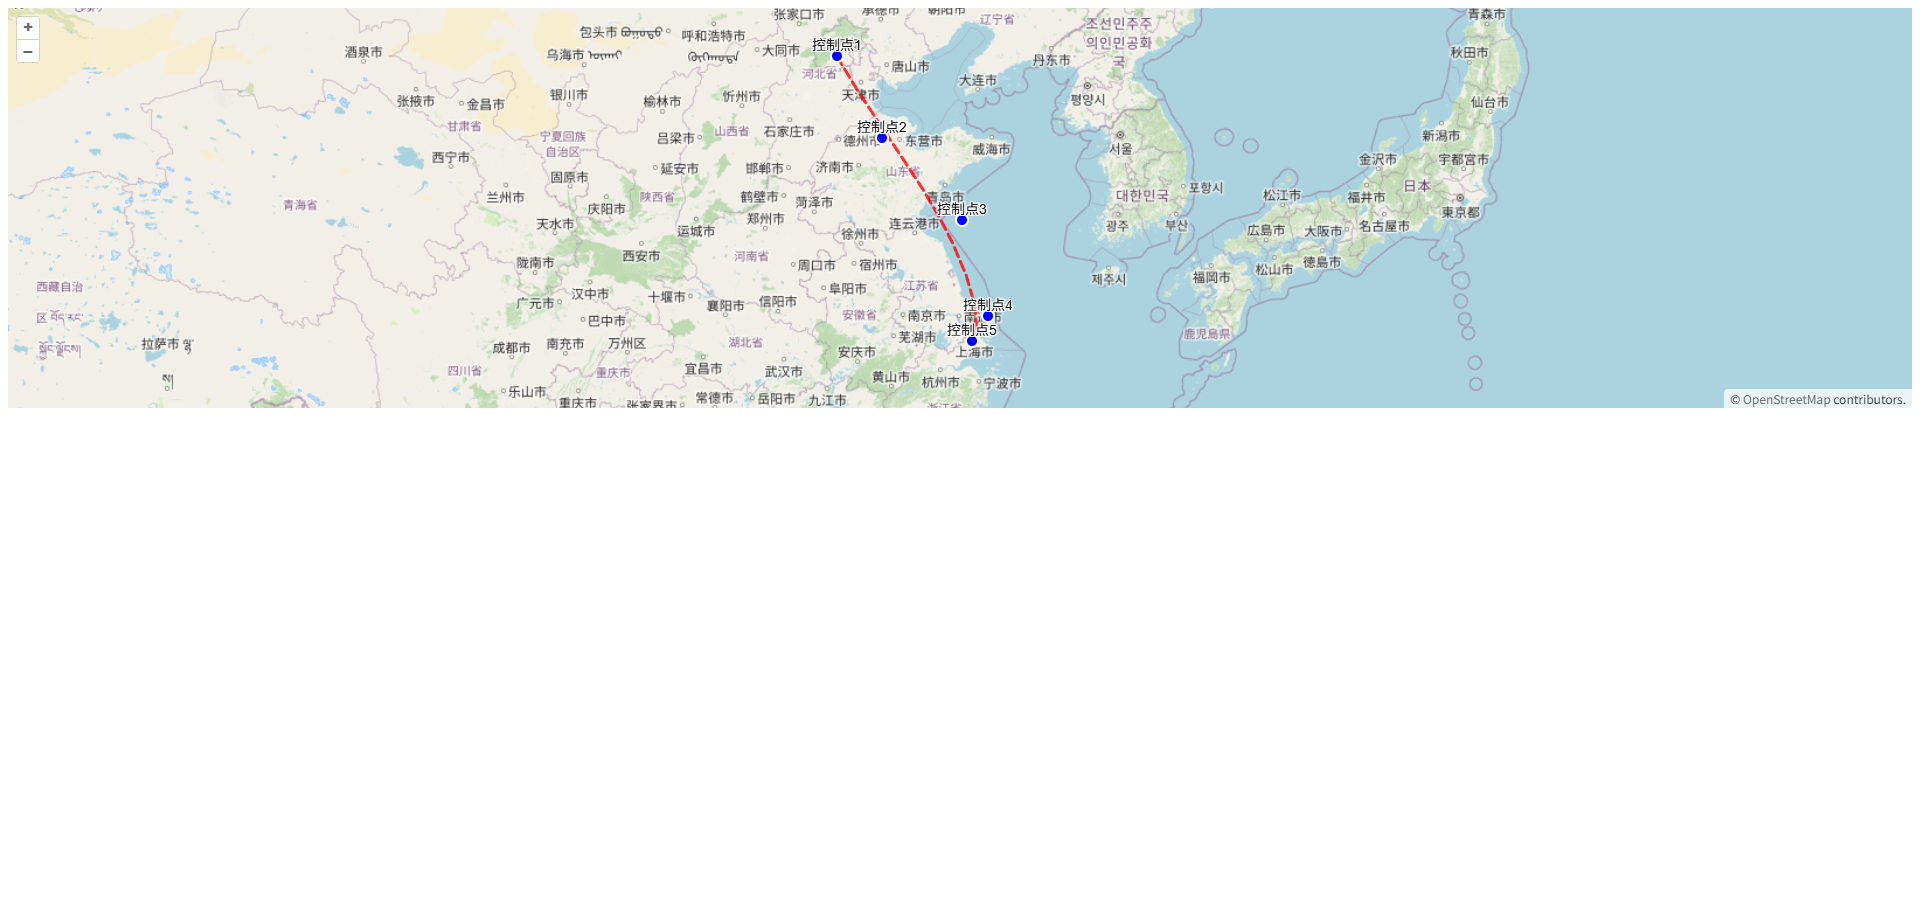
(注:实际运行时会显示OpenStreetMap底图和红色贝塞尔曲线)


