图表标题自定义部分代码:
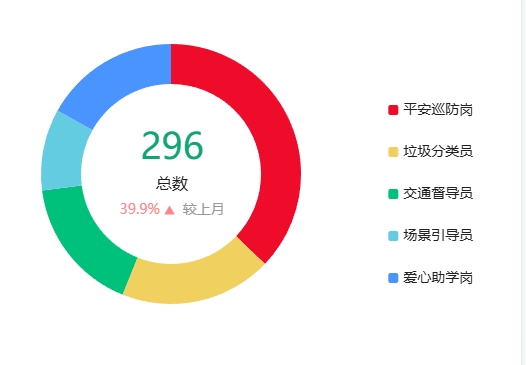
title: {text: `{a|${sum}}\n{b|总数}`,subtext: `{a|${num}} {trendIcon|} {c|较上月}`,textAlign: 'center',left: '32%',top: '32%',textStyle: {rich: {a: {fontFamily: 'DINPro, DINPro',fontWight: 'bold',fontSize: 36,color: '#0FA674',lineHeight: 46},b: {fontFamily: 'Source Han Sans CN, Source Han Sans CN',fontWeight: '500',fontSize: 16,color: '#212121',lineHeight: 24,marginTop: 8,marginBottom: 8},}},subtextStyle: {rich: {a: {fontFamily: 'Source Han Sans CN, Source Han Sans CN',fontWeight: '500',fontSize: 14,color: '#FF8484',lineHeight: 24},trendIcon: {backgroundColor: {image: type == 'up' ? arrowUp : arrowDw},},c: {fontFamily: 'Source Han Sans CN, Source Han Sans CN',fontWeight: '500',fontSize: 14,color: '#999999',lineHeight: 24}}},},标题中的三角符号,我是直接用的图片,这块有一个判断,上升箭头向上,下降反之。之前打算引用一张图片,使用 transform: rotate(180deg); 但是没用,后面我就引用了两张图
全部代码:
<!--物种等级-->
<template><div id="chartSpeciesDom" ref="chartSpeciesContent" class="charts-content"></div>
</template>
<script lang="ts" setup>
// 图片
import arrowUp from '@/assets/images/wildlife/dashboard/arrow_up.png';
import arrowDw from '@/assets/images/wildlife/dashboard/arrow_dw.png';
//echarts
import * as echarts from 'echarts';//静态文件
import theme from "@/assets/echarts/dark.json";
// 初始化
onMounted(()=>{initChart()getChart()
})
/*** 图表*/
type EChartsOption = echarts.EChartsOption;
let chartSpeciesDom
let chartSpecies
function initChart() {echarts.registerTheme('dark', theme);chartSpeciesDom = document.getElementById('chartSpeciesDom')!;chartSpecies = echarts.init(chartSpeciesDom, 'dark');
}
let option;
function getChart() {let values = [110,56,50,30,50];let sum = values[0] + values[1] + values[2] + values[3] + values[4] ;let legendData = ["平安巡防岗", "垃圾分类员", "交通督导员", "场景引导员", "爱心助学岗"];let colorList = ['#EF0C2B', '#F0D160', '#00C17B', '#63CCE1', '#4A94FF'];let num = '39.9%';let type = 'up'option = {title: {text: `{a|${sum}}\n{b|总数}`,subtext: `{a|${num}} {trendIcon|}  {c|较上月}`,textAlign: 'center',left: '32%',top: '32%',textStyle: {rich: {a: {fontFamily: 'DINPro, DINPro',fontWight: 'bold',fontSize: 36,color: '#0FA674',lineHeight: 46},b: {fontFamily: 'Source Han Sans CN, Source Han Sans CN',fontWeight: '500',fontSize: 16,color: '#212121',lineHeight: 24,marginTop: 8,marginBottom: 8},}},subtextStyle: {rich: {a: {fontFamily: 'Source Han Sans CN, Source Han Sans CN',fontWeight: '500',fontSize: 14,color: '#FF8484',lineHeight: 24},trendIcon: {backgroundColor: {image: type == 'up' ? arrowUp : arrowDw},},c: {fontFamily: 'Source Han Sans CN, Source Han Sans CN',fontWeight: '500',fontSize: 14,color: '#999999',lineHeight: 24}}},},tooltip: {trigger: 'item',borderColor: 'rgba(255,255,255,.3)',backgroundColor: 'rgba(13,5,30,.6)',borderWidth: 1,padding: 5,textStyle:{color:'#fff'}},legend: {type: "scroll",orient: 'vertical',right: '5%',align: 'auto',top: 'middle',itemWidth: 10,itemHeight: 10,textStyle: {fontSize:14,color: '#212121',lineHeight: 32},data: legendData},series: [{type: 'pie',left: '16%',center: ['20%', '45%'],radius: ['45%', '65%'],clockwise: true,avoidLabelOverlap: true,hoverOffset: 15,itemStyle: {normal: {color: function(params) {return colorList[params.dataIndex]}}},label: {show: false},data: [{name:legendData[0],value:values[0]},{name:legendData[1],value:values[1]},{name:legendData[2],value:values[2]},{name:legendData[3],value:values[3]},{name:legendData[4],value:values[4]}]}]};option && chartSpecies.setOption(option);
}
</script>
<style lang="scss" scoped>
.charts-content{width: 100%;height: 100%;
}
</style>


