前段时间接到一个需求,希望可以监控 Nginx 的运行状态。
我们都知道 Nginx 作为一个流行的 Web 服务器提供了多种能力,包括反向代理、负载均衡;也支持了许多协议,包括:
gRPC
http
WebSocket 等 作为一个流量入口的中间件,对其的监控就显得至关重要了。
市面上也有一些现成的产品可以监控 Nginx,比如知名的监控服务商 datadog 也提供了 Nginx 的监控。
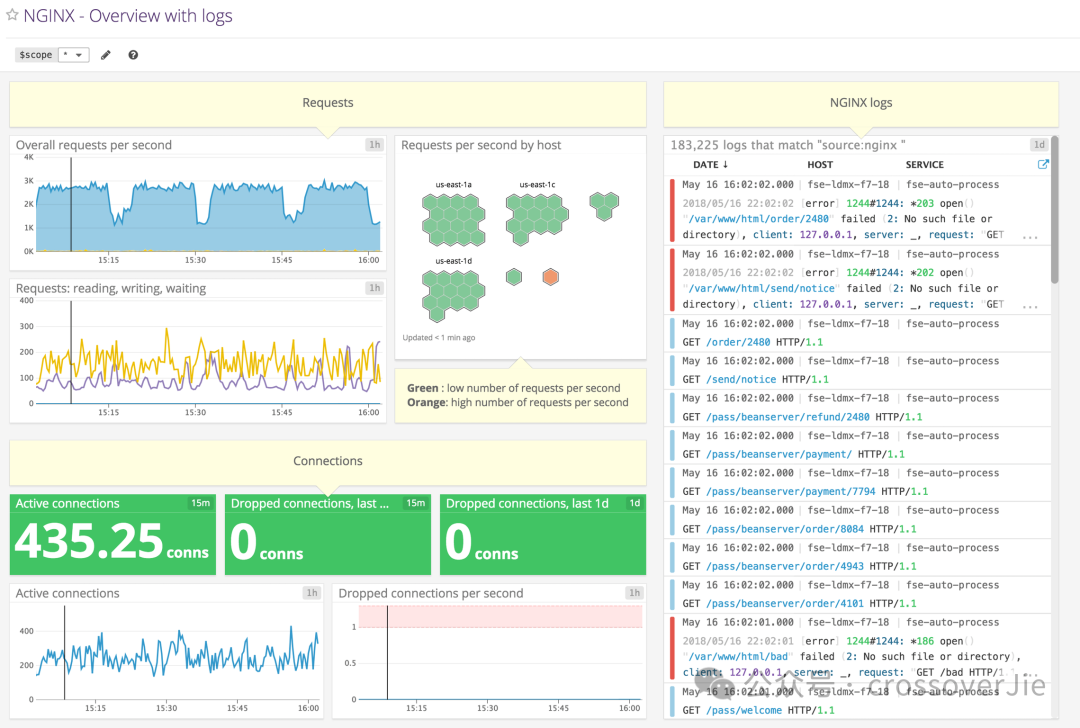
但是我这是一个内网服务,并不能使用这些外部的云厂商,所有就只能在内部搭建 Nginx 的监控服务了。
不过 Nginx 默认情况下并没有提供 /metrics 的 endpoint,但好在它提供了一个额外的模块:stub_status 可以用于获取监控数据。
server {listen 80;server_name _;location /status {stub_status on;access_log off;}location / {root /usr/share/nginx/html;index index.html index.htm;}}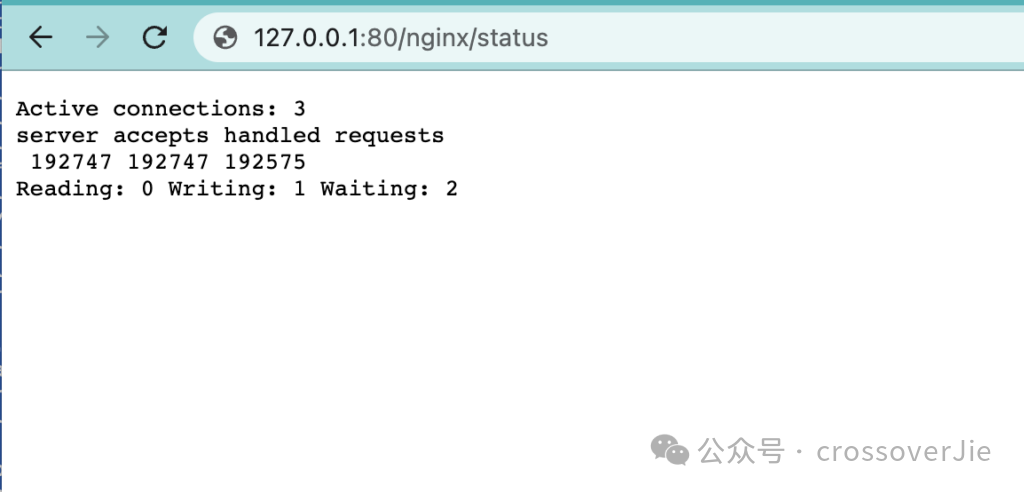 这样访问
这样访问 http://127.0.0.1:80/status 就可以拿到一些基本的运行数据。
但这个格式明显不是 Prometheus 所支持的 metrics 格式,无法直接将数据采集到 Prometheus 中然后通过 Grafana 进行查看。
所以还得需要一个中间层来将这些数据转换为 Prometheus 可以接收的 metrics 数据。
nginx-prometheus-exporter
好在社区已经提供了类似的工具:nginx-prometheus-exporter 它读取刚才 status endpoint 所暴露的数据,然后转换为 Prometheus 格式,并对外提供了一个 /metrics 的 endpoint 供 Prometheus 来采集。
转换数据
我们在启动这个 nginx-exporter 时需要传入刚才 Nginx 暴露的 /status endpoint。
docker run -p 9113:9113 nginx/nginx-prometheus-exporter:1.1.0 --nginx.scrape-uri=http://<nginx>:8080/stub_statusconst templateMetrics string = `Active connections: %d
server accepts handled requests
%d %d %d
Reading: %d Writing: %d Waiting: %d
`// 读取 Nginx status 数据
body, err := io.ReadAll(resp.Body)
if err != nil {return nil, fmt.Errorf("failed to read the response body: %w", err)
}r := bytes.NewReader(body)
stats, err := parseStubStats(r)
if err != nil {return nil, fmt.Errorf("failed to parse response body %q: %w", string(body), err)
}// 解析 Nginx status 数据
func parseStubStats(r io.Reader) (*StubStats, error) {var s StubStatsif _, err := fmt.Fscanf(r, templateMetrics,&s.Connections.Active,&s.Connections.Accepted,&s.Connections.Handled,&s.Requests,&s.Connections.Reading,&s.Connections.Writing,&s.Connections.Waiting); err != nil {return nil, fmt.Errorf("failed to scan template metrics: %w", err)}return &s, nil
}最后会把刚才解析到的数据生成 metrics:
ch <- prometheus.MustNewConstMetric(c.metrics["connections_active"], prometheus.GaugeValue, float64(stats.Connections.Active))
ch <- prometheus.MustNewConstMetric(c.metrics["connections_accepted"], prometheus.CounterValue, float64(stats.Connections.Accepted))
ch <- prometheus.MustNewConstMetric(c.metrics["connections_handled"], prometheus.CounterValue, float64(stats.Connections.Handled))
ch <- prometheus.MustNewConstMetric(c.metrics["connections_reading"], prometheus.GaugeValue, float64(stats.Connections.Reading))
ch <- prometheus.MustNewConstMetric(c.metrics["connections_writing"], prometheus.GaugeValue, float64(stats.Connections.Writing))
ch <- prometheus.MustNewConstMetric(c.metrics["connections_waiting"], prometheus.GaugeValue, float64(stats.Connections.Waiting))
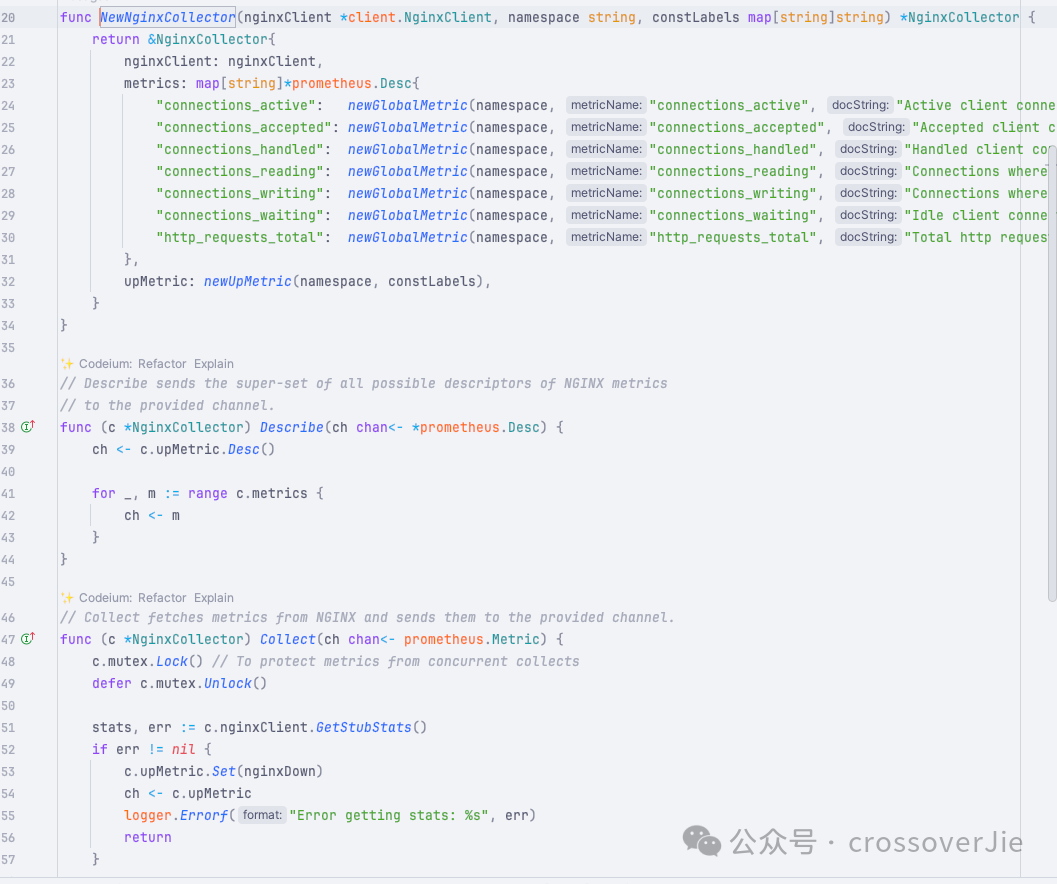
ch <- prometheus.MustNewConstMetric(c.metrics["http_requests_total"], prometheus.CounterValue, float64(stats.Requests))这些 metrics 是一开始就定义好的:
// NewNginxCollector creates an NginxCollector.
func NewNginxCollector(nginxClient *client.NginxClient, namespace string, constLabels map[string]string, logger log.Logger) *NginxCollector {return &NginxCollector{nginxClient: nginxClient,logger:      logger,metrics: map[string]*prometheus.Desc{"connections_active":   newGlobalMetric(namespace, "connections_active", "Active client connections", constLabels),"connections_accepted": newGlobalMetric(namespace, "connections_accepted", "Accepted client connections", constLabels),"connections_handled":  newGlobalMetric(namespace, "connections_handled", "Handled client connections", constLabels),"connections_reading":  newGlobalMetric(namespace, "connections_reading", "Connections where NGINX is reading the request header", constLabels),"connections_writing":  newGlobalMetric(namespace, "connections_writing", "Connections where NGINX is writing the response back to the client", constLabels),"connections_waiting":  newGlobalMetric(namespace, "connections_waiting", "Idle client connections", constLabels),"http_requests_total":  newGlobalMetric(namespace, "http_requests_total", "Total http requests", constLabels),},upMetric: newUpMetric(namespace, constLabels),}
}
而这个函数是在 exporter 启动时候会调用:
"github.com/prometheus/client_golang/prometheus"prometheus.MustRegister(collector.NewNginxCollector(ossClient, "nginx", labels, logger))使用的是 prometheus 包提供的注册函数,将我们刚才自定义的获取 metrics 的逻辑注册进去,这样当我们在 Prometheus 中配置好采集任务之后就可以定期扫描 /status 的数据然后转换为 Prometheus 指标返回。
global:scrape_interval: 10s
scrape_configs:- job_name: nginx-exportorstatic_configs:- targets: ['127.0.0.1:9113']
这样就可以将 nginx status 的数据定期采集到 Prometheus 中了,最后使用社区提供的 grafana 面板便可以可视化的查看这些监控数据: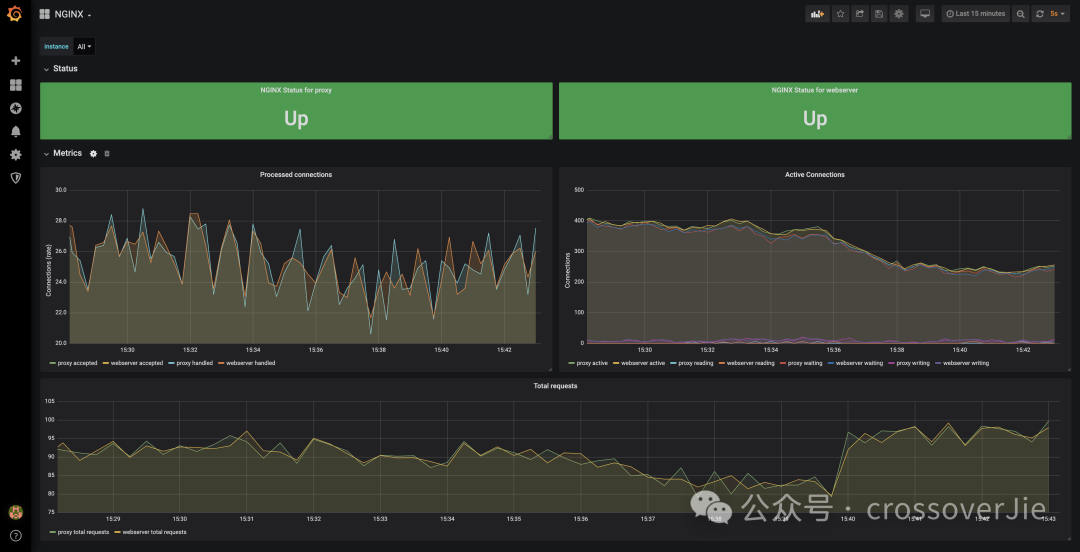
Nginx Plus
同时这个 nginx-exporter 还支持 Nginx Plus(这是 Nginx 的商用增强版),它的实现原理类似,只是它支持的指标更多一些而已。
type NginxPlusCollector struct {  upMetric                       prometheus.Gauge  logger                         log.Logger  cacheZoneMetrics               map[string]*prometheus.Desc  workerMetrics                  map[string]*prometheus.Desc  nginxClient                    *plusclient.NginxClient  streamServerZoneMetrics        map[string]*prometheus.Desc  streamZoneSyncMetrics          map[string]*prometheus.Desc  streamUpstreamMetrics          map[string]*prometheus.Desc  streamUpstreamServerMetrics    map[string]*prometheus.Desc  locationZoneMetrics            map[string]*prometheus.Desc  resolverMetrics                map[string]*prometheus.Desc  limitRequestMetrics            map[string]*prometheus.Desc  limitConnectionMetrics         map[string]*prometheus.Desc  streamLimitConnectionMetrics   map[string]*prometheus.Desc  upstreamServerMetrics          map[string]*prometheus.Desc  upstreamMetrics                map[string]*prometheus.Desc  streamUpstreamServerPeerLabels map[string][]string  serverZoneMetrics              map[string]*prometheus.Desc  upstreamServerLabels           map[string][]string  streamUpstreamServerLabels     map[string][]string  serverZoneLabels               map[string][]string  streamServerZoneLabels         map[string][]string  upstreamServerPeerLabels       map[string][]string  workerLabels                   map[string][]string  cacheZoneLabels                map[string][]string  totalMetrics                   map[string]*prometheus.Desc  variableLabelNames             VariableLabelNames  variableLabelsMutex            sync.RWMutex  mutex                          sync.Mutex
}
Prometheus 社区中提供不少这类 exporter: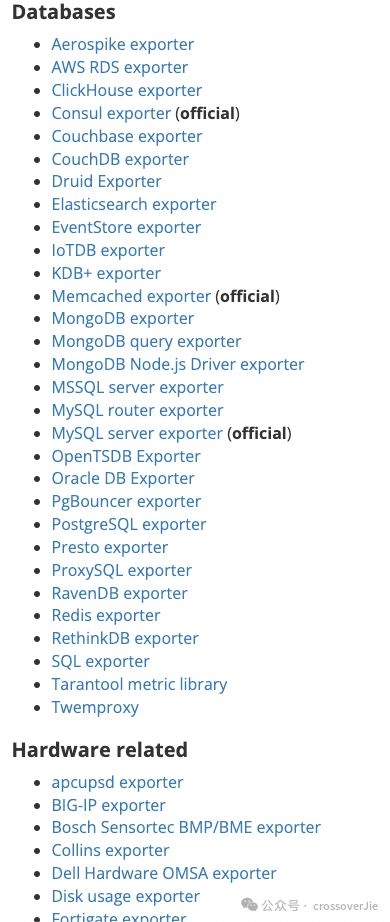
这些 exporter 要解决的问题都是类似的,对于一些没有暴露 /metrics 的中间件通过他们提供的客户端直连,然后将获取到的数据转换为 Prometheus 所支持的格式。
需要单独的 exporter 支持的中间件大部分都是一些老牌产品,在设计之初就没有考虑可观测性的需求,现在一些新的中间件几乎都原生支持 metrics,这种产品只需要在 Prometheus 中配置采集任务即可。
Cprobe
不知道大家发现没有,社区中提供的 exporter 还是挺多的,但如果我们都需要在自己的生产环境将这些 exporter 部署起来多少会有些繁琐:
不同的 exporter 需要的参数可能不同
暴露的端口可能不同
配置文件难以统一管理
在这个背景下社区有大佬发起了一个 cprobe 项目,这是一个大而全的项目,可以将散落在各处的 exporter 都整合在一起。
并且统一抽象了接入方式,使得所有的插件都可以用类似的配置书写方式来维护这些插件。
目前已经支持以下一些常用的中间件:
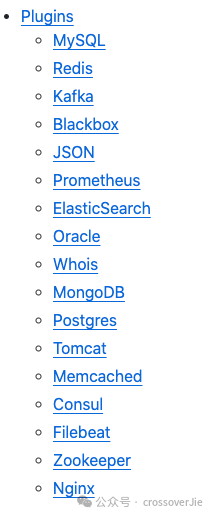
这里的 Nginx 就是本次监控的需求贡献的,因为还需要监控这里支持的一些其他中间件,所以最终也是使用 cprobe 来部署监控。
整合 Nginx exporter 到 Cprobe 中
下面来看看如何将社区中已经存在的 Nginx exporter 整合到 cprobe 中:
在开始之前我们先要抽象出这个插件需要哪些配置?
这个其实很好解决,我们直接看看需要实现的 exporter 中提供了哪些参数,这里以 Nginx 的为例: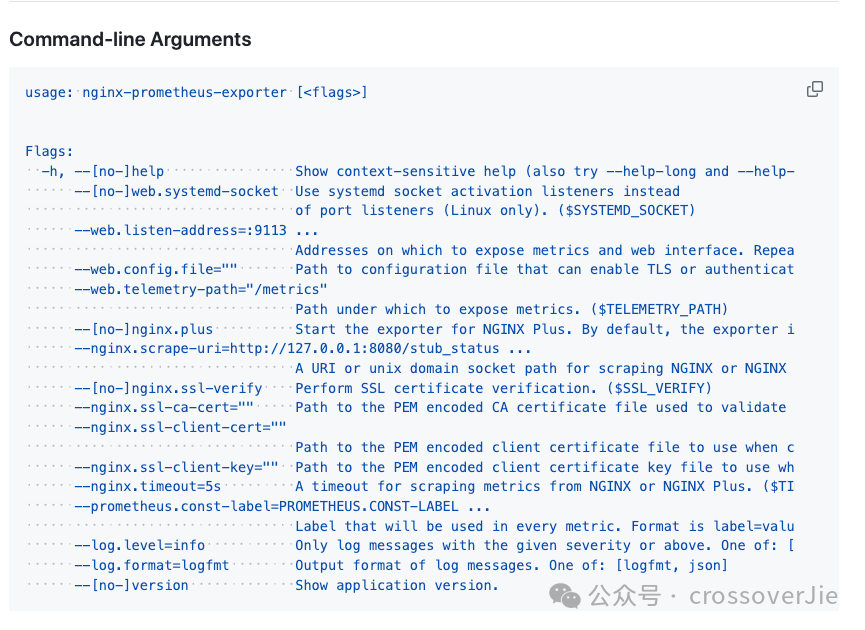
排除掉一些我们不需要的,比如端口、日志级别、endpoint等配置之外,就只需要一些关于 SSL 的配置,所以最终我们需要的配置文件如下:
nginx_plus = false
# Path to the PEM encoded CA certificate file used to validate the servers SSL certificate.
ssl_ca_cert = ''
# Path to the PEM encoded client certificate file to use when connecting to the server.
ssl_client_cert = ''
# Path to the PEM encoded client certificate key file to use when connecting to the server.
ssl_client_key = ''
# Perform SSL certificate verification.
ssl_verify = false
timeout = '5s'
然后将这个 toml 里的配置转换为一个 struct。
在 cprobe 中有一个核心的接口:
type Plugin interface {// ParseConfig is used to parse configParseConfig(baseDir string, bs []byte) (any, error)// Scrape is used to scrape metrics, cfg need to be cast specific cfgScrape(ctx context.Context, target string, cfg any, ss *types.Samples) error
}
ParseConfig 用于将刚才的配置文件流格式化为插件所需要的配置。
Scrape 函数则是由 cprobe 定时调用的函数,会传入抓取的目标地址,每个插件将抓到的数据写入 *types.Samples 中即可。
cprobe 会将 *types.Samples 的数据发送到 remote 的 Prometheus 中。
接下来看看 Nginx 插件的实现:
type Config struct {NginxPlus     bool          `toml:"nginx_plus"`SSLCACert     string        `toml:"ssl_ca_cert"`SSLClientCert string        `toml:"ssl_client_cert"`SSLClientKey  string        `toml:"ssl_client_key"`SSLVerify     bool          `toml:"ssl_verify"`Timeout       time.Duration `toml:"timeout"`
}func (n *Nginx) ParseConfig(baseDir string, bs []byte) (any, error) {var c Configerr := toml.Unmarshal(bs, &c)if err != nil {return nil, err}if c.Timeout == 0 {c.Timeout = time.Millisecond * 500}return &c, nil
}
ParseConfig 很简单,就是将配置文件转换为 struct。
抓取函数 Scrape 也很简单:
collect, err := registerCollector(transport, target, nil, conf)
if err != nil {  return err
}  ch := make(chan prometheus.Metric)
go func() {  collect.Collect(ch)  close(ch)
}()
就是构建之前在 nginx exporter 中的 prometheus.Collector,其实代码大部分也是从那边复制过来的。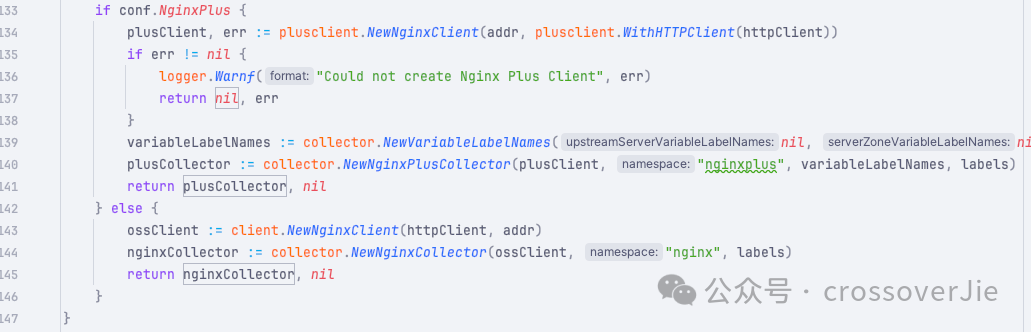
 所以其实迁移一个 exporter 到 cprobe 中非常简单,只需要:
定义好需要的配置。
去掉不需要的代码,比如日志、端口之类的。
适配好刚才那两个核心函数
ParseConfig/Scrape即可。
但这样也有些小问题,现有的一些 exporter 还在迭代,那边更新的版本需要有人及时同步过来。
除非有一天 cprobe 可以作为一个标准,版本更新都在 cprobe 这边完成,这样就真的是做大做强了。
不过这些依旧是适配老一代的中间件产品,逐步都会适配现代的可观测体系,这些 exporter 也会逐渐走下历史舞台。
最后夹带一点私活,最近做了一个知识星球,已经试运行一段时间,效果还不错(具体详情可以扫码查看);感兴趣的朋友可以扫码领取优惠券以 49 元的价格加入(支持三天内无条件退款)。

参考链接:
https://prometheus.io/docs/instrumenting/exporters/
https://github.com/nginxinc/nginx-prometheus-exporter
往期推荐
载均衡技术全解析:Pulsar 分布式系统的最佳实践
我是如何从零到成为 Apache 顶级项目的 Committer
开源项目如何做集成测试
从Helm到 Operator:Kubernetes应用管理的进化
如何找到并快速上手一个开源项目

点分享

点收藏

点点赞

点在看


