一、环境准备
1、准备一个 hive 的环境,并可以进行远程连接
2、环境中安装有 sqoop 和 mysql
3、DeepSeek 我使用的是 《问小白》
注册地址:打开问小白,填入我的分享码【1VYXOI】使用满血DeepSeek R1,零延迟、不卡、不限次、不收费!问小白 - 更专业的AI搜索
二、数据准备
使用你的数据或者我的数据都可以,我的数据如下,请自行下载:
📎ai示例.zip
三、案例效果图
四、操作步骤
1、使用 DeepSeek 创建 hive 表结构
提示词:根据以上 3 个文件,生成 hive 的建表语句,建表时字段为英文,注释为中文,字段名称不要太长,注意第一行是我们的表头。
drop database ai_test cascade ;
create database ai_test;CREATE TABLE IF NOT EXISTS public_charging_pile (dt STRING COMMENT '时间,格式为YYYY-MM-DD',cq INT COMMENT '重庆公共类充电桩数量(台)',bj INT COMMENT '北京公共类充电桩数量(台)',gd INT COMMENT '广东公共类充电桩数量(台)',sh INT COMMENT '上海公共类充电桩数量(台)',zj INT COMMENT '浙江公共类充电桩数量(台)',ah INT COMMENT '安徽公共类充电桩数量(台)',tj INT COMMENT '天津公共类充电桩数量(台)',sc INT COMMENT '四川公共类充电桩数量(台)',sd INT COMMENT '山东公共类充电桩数量(台)',js INT COMMENT '江苏公共类充电桩数量(台)',dc_national INT COMMENT '全国直流充电桩数量(台)',ac_national INT COMMENT '全国交流充电桩数量(台)'
)
ROW FORMAT DELIMITED
FIELDS TERMINATED BY ','
STORED AS TEXTFILE
TBLPROPERTIES ('skip.header.line.count'='1');CREATE TABLE IF NOT EXISTS gasoline_price (dt STRING COMMENT '时间,格式为YYYY年MM月',price_98 DECIMAL(12,10) COMMENT '98#汽油全国零售价格(元/升)',price_95 DECIMAL(12,10) COMMENT '95#汽油全国零售价格(元/升)',price_92 DECIMAL(12,10) COMMENT '92#汽油全国零售价格(元/升)'
)
ROW FORMAT DELIMITED
FIELDS TERMINATED BY ','
STORED AS TEXTFILE
TBLPROPERTIES ('skip.header.line.count'='1');CREATE TABLE IF NOT EXISTS new_energy_vehicle (dt STRING COMMENT '时间,格式为YYYY年MM月',production_total DECIMAL(10,2) COMMENT '新能源汽车产量(万辆)',sales_total DECIMAL(10,2) COMMENT '新能源汽车销量(万辆)',production_ev DECIMAL(10,2) COMMENT '纯电动汽车产量(万辆)',sales_ev DECIMAL(10,2) COMMENT '纯电动汽车销量(万辆)',production_phev DECIMAL(10,2) COMMENT '插电式混合动力汽车产量(万辆)',sales_phev DECIMAL(10,2) COMMENT '插电式混合动力汽车销量(万辆)'
)
ROW FORMAT DELIMITED
FIELDS TERMINATED BY ','
STORED AS TEXTFILE
TBLPROPERTIES ('skip.header.line.count'='1');
2、将数据加载到 hive 表中
load data local inpath '/home/test_ai/全国新能源汽车产销量.csv' into table new_energy_vehicle;
load data local inpath '/home/test_ai/公共类充电桩数量(台).csv' into table public_charging_pile;
load data local inpath '/home/test_ai/汽油数据.csv' into table gasoline_price;
3、使用 DeepSeek 开启 hive 的本地模式
提示词:请帮我查询开启hive本地模式的命令,我使用的是hive3.1.2
SET hive.exec.mode.local.auto = true; -- 核心参数,默认为false
SET hive.exec.mode.local.auto.inputbytes.max = 134217728; -- 输入数据量阈值(默认128MB)
SET hive.exec.mode.local.auto.input.files.max = 4; -- 输入文件数阈值(默认4个)
4、 让 DeepSeek 根据表结构挖掘可以做的需求
提示词:通过以上三个表中的数据,能统计哪些指标,这些指标最好是多个表关联才能查找出来的最好。
以前生成的需求如下:
1. 能源价格与新能源车销量关联分析
需求:汽油价格波动对新能源汽车销量的影响系数
2. 充电桩建设与新能源车产能关系
需求:充电桩数量增速与新能源车产量增速的滞后效应
3. 区域充电设施与市场渗透率对比
需求:重点省份充电桩密度 vs 新能源车销量占比
4、技术路线竞争分析
需求:直流桩占比 vs 纯电动车销量渗透率
现在的需求:
一、能源替代效应分析
油价波动与新能源汽车销量动态关系
关联汽油价格表和新能源汽车产销量表,分析油价上涨对新能源汽车销量的影响
SELECT gp.dt AS month,gp.price_92,ne.sales_total,(ne.sales_total - LAG(ne.sales_total) OVER (ORDER BY gp.dt)) / LAG(ne.sales_total) OVER (ORDER BY gp.dt) AS sales_growth_rate
FROM gasoline_price gp
JOIN new_energy_vehicle ne ON gp.dt = ne.dt;
将数据写入 hive 表中:
create table ads_yj_xl_gl as
SELECTgp.dt AS month,gp.price_92,ne.sales_total,(ne.sales_total - LAG(ne.sales_total) OVER (ORDER BY gp.dt)) / LAG(ne.sales_total) OVER (ORDER BY gp.dt) AS sales_growth_rate
FROM gasoline_price gp
JOIN new_energy_vehicle ne ON gp.dt = ne.dt;
其他需求,请自行按照上面的放入统计写入 hive 的 ads 层。
二、充电桩覆盖率与燃油车使用成本对比
结合充电桩数量、油价及新能源汽车销量,计算每万辆车充电桩保有量,并与燃油成本对比:
SELECT pc.dt,(pc.dc_national + pc.ac_national) / ne.sales_total AS charging_pile_per_10k_vehicles,gp.price_92 * 12 AS annual_fuel_cost_per_car -- 假设年均行驶里程折算
FROM public_charging_pile pc
JOIN new_energy_vehicle ne ON SUBSTR(pc.dt, 1, 7) = ne.dt
JOIN gasoline_price gp ON ne.dt = gp.dt;
三、充电设施与产销协同性分析
充电桩类型分布与车型销量匹配度
SELECT ne.dt,ne.production_ev AS pure_electric_production,ne.production_phev AS plug_in_hybrid_production,pc.dc_national AS fast_charging_piles,pc.ac_national AS slow_charging_piles
FROM new_energy_vehicle ne
JOIN public_charging_pile pc ON ne.dt = DATE_FORMAT(pc.dt, 'yyyy-MM');
区域充电设施密度与新能源汽车渗透率
SELECT pc.dt,pc.cq AS chongqing_piles,pc.gd AS guangdong_piles,ne.sales_total * 0.3 AS estimated_regional_sales -- 假设TOP10省份占比70%
FROM public_charging_pile pc
JOIN new_energy_vehicle ne ON SUBSTR(pc.dt, 1, 7) = ne.dt;
5、使用 DeepSeek 编写 sqoop 命令,将数据导出 mysql
在 mysql 中创建一个表:
create database ai_test_bi;提示词:
根据如下 hive 中该表的建表语句,生成 mysql 的建表语句,表名和 hive 的表名一致:
create temporary table ads_yj_xl_gl
(
month string,
price_92 decimal(12, 10),
sales_total decimal(10, 2),
sales_growth_rate decimal(24, 13)
);
生成的 sql 建表语句如下:
CREATE TABLE ads_yj_xl_gl (month VARCHAR(20) NOT NULL COMMENT '月份,格式为YYYY年MM月',price_92 DECIMAL(12,10) COMMENT '92#汽油全国零售价格(元/升)',sales_total DECIMAL(10,2) COMMENT '新能源汽车总销量(万辆)',sales_growth_rate DECIMAL(24,13) COMMENT '销量增长率'
) ENGINE=InnoDB DEFAULT CHARSET=utf8mb4 COLLATE=utf8mb4_general_ci;
提示词:请仿照如下格式:
sqoop export \
--connect jdbc:mysql://node01:3306/gongcheng \
--username root \
--password 123456 \
--table user3 \
--hcatalog-database hive03 \
--hcatalog-table par3 \
-m 1
编写一个 sqoop 命令,将 hive 中的 ai_test 数据库中的ads_yj_xl_gl 数据导出到 mysql 数据库中,mysql 数据库的主机名是 node01,用户名是 root,密码是 123456
生成的命令如下:
sqoop export \
--connect jdbc:mysql://node01:3306/ai_test_bi \
--username root \
--password 123456 \
--table ads_yj_xl_gl \
--hcatalog-database ai_test \
--hcatalog-table ads_yj_xl_gl \
-m 1
6、使用 DeepSeek 编写可视化界面,并运行 [python+echarts]
提示词如下:
假如我有一个mysql表,mysql的数据库名字是ai_test_bi,主机名是node01,用户名和密码是root,123456,mysql中有一个表ads_yj_xl_gl,表的建表语句如下:
CREATE TABLE ads_yj_xl_gl (month VARCHAR(20) NOT NULL COMMENT '月份,格式为YYYY年MM月',price_92 DECIMAL(12,10) COMMENT '92#汽油全国零售价格(元/升)',sales_total DECIMAL(10,2) COMMENT '新能源汽车总销量(万辆)',sales_growth_rate DECIMAL(24,13) COMMENT '销量增长率'
);
请编写一个python代码,python中使用echarts,帮我展示几个图表,这些图表和我的表ads_yj_xl_gl中的数据需要契合。
pip install pandas sqlalchemy pyecharts pymysql会出现一个错误:
以上代码报错:
UserWarning: pandas only supports SQLAlchemy connectable (engine/connection) or database string URI or sqlite3 DBAPI2 connection. Other DBAPI2 objects are not tested. Please consider using SQLAlchemy.df = pd.read_sql(query, conn)
Traceback (most recent call last):File "D:\企业实习课\pyspark_workspace\pythonProject2\pythonProject\test_ai.py", line 132, in <module>chart = create_combined_chart(df)File "D:\企业实习课\pyspark_workspace\pythonProject2\pythonProject\test_ai.py", line 68, in create_combined_chartaxisline_opts=opts.AxisLineOpts(linestyle_color="#5793f3")
TypeError: __init__() got an unexpected keyword argument 'linestyle_color'
请重新生成
import pandas as pd
from sqlalchemy import create_engine
from pyecharts.charts import Line, Grid, Scatter
from pyecharts import options as opts# MySQL连接配置
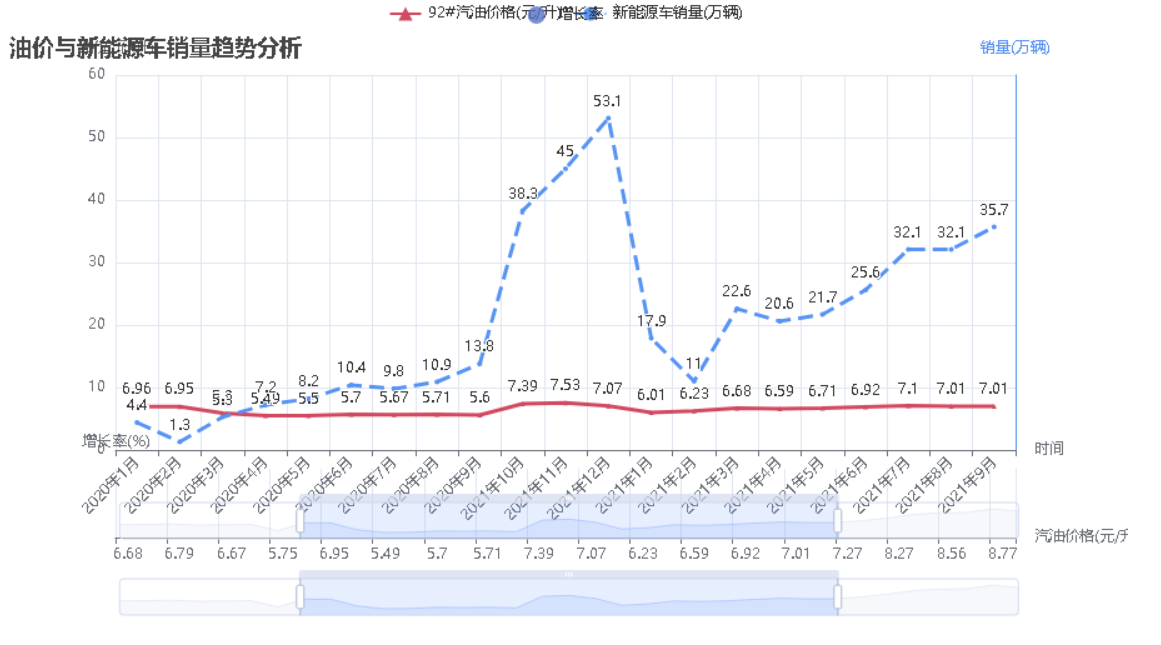
def fetch_and_process_data():try:engine = create_engine("mysql+pymysql://root:123456@node01:3306/ai_test_bi""?charset=utf8mb4")query = """SELECT DATE_FORMAT(STR_TO_DATE(month, '%Y年%m月'), '%Y-%m') AS month,price_92,sales_total,sales_growth_rateFROM ads_yj_xl_glORDER BY STR_TO_DATE(month, '%Y年%m月')"""df = pd.read_sql(query, engine)df['sales_growth_rate'] = df['sales_growth_rate'].fillna(0)return dfexcept Exception as e:print(f"数据库错误:{str(e)}")return pd.DataFrame()def create_combined_chart(df):# 主趋势图line = (Line(init_opts=opts.InitOpts(width="1600px", height="600px")).add_xaxis(df['month'].tolist()).add_yaxis("92#汽油价格(元/升)", df['price_92'].round(2).tolist(),yaxis_index=0, color="#d14a61", symbol="triangle",linestyle_opts=opts.LineStyleOpts(width=3)).add_yaxis("新能源车销量(万辆)", df['sales_total'].round(1).tolist(),yaxis_index=1, color="#5793f3", symbol="circle",linestyle_opts=opts.LineStyleOpts(width=3, type_="dashed")).extend_axis(yaxis=opts.AxisOpts(name="销量(万辆)", type_="value", position="right",axisline_opts=opts.AxisLineOpts(linestyle_opts=opts.LineStyleOpts(color="#5793f3")))).set_global_opts(title_opts=opts.TitleOpts(title="油价与新能源车销量趋势分析", pos_top="5%"),datazoom_opts=[opts.DataZoomOpts(pos_bottom="15%")],yaxis_opts=opts.AxisOpts(name="油价(元/升)", splitline_opts=opts.SplitLineOpts(is_show=True)),xaxis_opts=opts.AxisOpts(name="时间", axislabel_opts=opts.LabelOpts(rotate=45))))# 增长率散点图scatter = (Scatter().add_xaxis(df['price_92'].round(2).tolist()).add_yaxis("增长率", (df['sales_growth_rate']*100).round(2).tolist(),symbol_size=12, label_opts=opts.LabelOpts(is_show=False)).set_global_opts(xaxis_opts=opts.AxisOpts(name="汽油价格(元/升)"),yaxis_opts=opts.AxisOpts(name="增长率(%)", axislabel_opts=opts.LabelOpts(formatter="{value}%"))))grid = (Grid().add(line, grid_opts=opts.GridOpts(pos_left="10%", pos_right="10%", height="60%")).add(scatter, grid_opts=opts.GridOpts(pos_left="10%", pos_right="10%", pos_top="75%")))return gridif __name__ == "__main__":df = fetch_and_process_data()if not df.empty:chart = create_combined_chart(df)chart.render("energy_analysis_fixed.html")print("可视化文件生成成功:energy_analysis_fixed.html")else:print("数据获取失败,请检查数据库连接")有可能还有别的错误:
ModuleNotFoundError: No module named 'sqlalchemy'解决方案:
pip install sqlalchemy再次运行,无错误:
<!DOCTYPE html>
<html>
<head><meta charset="UTF-8"><title>Awesome-pyecharts</title><script type="text/javascript" src="https://assets.pyecharts.org/assets/v5/echarts.min.js"></script></head>
<body ><div id="c11f1b5d33074118ac3ebbb30ff32fd5" class="chart-container" style="width:900px; height:500px; "></div><script>var chart_c11f1b5d33074118ac3ebbb30ff32fd5 = echarts.init(document.getElementById('c11f1b5d33074118ac3ebbb30ff32fd5'), 'white', {renderer: 'canvas'});var option_c11f1b5d33074118ac3ebbb30ff32fd5 = {"animation": true,"animationThreshold": 2000,"animationDuration": 1000,"animationEasing": "cubicOut","animationDelay": 0,"animationDurationUpdate": 300,"animationEasingUpdate": "cubicOut","animationDelayUpdate": 0,"aria": {"enabled": false},"color": ["#d14a61","#5793f3","#5470c6","#91cc75","#fac858","#ee6666","#73c0de","#3ba272","#fc8452","#9a60b4","#ea7ccc"],"series": [{"type": "line","name": "92#\u6c7d\u6cb9\u4ef7\u683c(\u5143/\u5347)","connectNulls": false,"xAxisIndex": 0,"yAxisIndex": 0,"symbol": "triangle","symbolSize": 4,"showSymbol": true,"smooth": false,"clip": true,"step": false,"stackStrategy": "samesign","data": [["2019\u5e7410\u6708",6.68],["2019\u5e7411\u6708",6.72],["2019\u5e7412\u6708",6.79],["2019\u5e749\u6708",6.63],["2020\u5e7410\u6708",6.67],["2020\u5e7411\u6708",6.72],["2020\u5e7412\u6708",5.75],["2020\u5e741\u6708",6.96],["2020\u5e742\u6708",6.95],["2020\u5e743\u6708",5.9],["2020\u5e744\u6708",5.49],["2020\u5e745\u6708",5.5],["2020\u5e746\u6708",5.7],["2020\u5e747\u6708",5.67],["2020\u5e748\u6708",5.71],["2020\u5e749\u6708",5.6],["2021\u5e7410\u6708",7.39],["2021\u5e7411\u6708",7.53],["2021\u5e7412\u6708",7.07],["2021\u5e741\u6708",6.01],["2021\u5e742\u6708",6.23],["2021\u5e743\u6708",6.68],["2021\u5e744\u6708",6.59],["2021\u5e745\u6708",6.71],["2021\u5e746\u6708",6.92],["2021\u5e747\u6708",7.1],["2021\u5e748\u6708",7.01],["2021\u5e749\u6708",7.01],["2022\u5e741\u6708",7.27],["2022\u5e742\u6708",7.72],["2022\u5e743\u6708",8.27],["2022\u5e744\u6708",8.52],["2022\u5e745\u6708",8.56],["2022\u5e746\u6708",9.13],["2022\u5e747\u6708",8.77]],"hoverAnimation": true,"label": {"show": true,"margin": 8,"valueAnimation": false},"logBase": 10,"seriesLayoutBy": "column","lineStyle": {"show": true,"width": 3,"opacity": 1,"curveness": 0,"type": "solid"},"areaStyle": {"opacity": 0},"zlevel": 0,"z": 0},{"type": "line","name": "\u65b0\u80fd\u6e90\u8f66\u9500\u91cf(\u4e07\u8f86)","connectNulls": false,"xAxisIndex": 0,"yAxisIndex": 0,"symbol": "circle","symbolSize": 4,"showSymbol": true,"smooth": false,"clip": true,"step": false,"stackStrategy": "samesign","data": [["2019\u5e7410\u6708",7.5],["2019\u5e7411\u6708",9.5],["2019\u5e7412\u6708",16.3],["2019\u5e749\u6708",8.0],["2020\u5e7410\u6708",16.0],["2020\u5e7411\u6708",20.0],["2020\u5e7412\u6708",24.8],["2020\u5e741\u6708",4.4],["2020\u5e742\u6708",1.3],["2020\u5e743\u6708",5.3],["2020\u5e744\u6708",7.2],["2020\u5e745\u6708",8.2],["2020\u5e746\u6708",10.4],["2020\u5e747\u6708",9.8],["2020\u5e748\u6708",10.9],["2020\u5e749\u6708",13.8],["2021\u5e7410\u6708",38.3],["2021\u5e7411\u6708",45.0],["2021\u5e7412\u6708",53.1],["2021\u5e741\u6708",17.9],["2021\u5e742\u6708",11.0],["2021\u5e743\u6708",22.6],["2021\u5e744\u6708",20.6],["2021\u5e745\u6708",21.7],["2021\u5e746\u6708",25.6],["2021\u5e747\u6708",32.1],["2021\u5e748\u6708",32.1],["2021\u5e749\u6708",35.7],["2022\u5e741\u6708",43.1],["2022\u5e742\u6708",33.4],["2022\u5e743\u6708",48.4],["2022\u5e744\u6708",29.9],["2022\u5e745\u6708",44.7],["2022\u5e746\u6708",59.6],["2022\u5e747\u6708",59.3]],"hoverAnimation": true,"label": {"show": true,"margin": 8,"valueAnimation": false},"logBase": 10,"seriesLayoutBy": "column","lineStyle": {"show": true,"width": 3,"opacity": 1,"curveness": 0,"type": "dashed"},"areaStyle": {"opacity": 0},"zlevel": 0,"z": 0},{"type": "scatter","name": "\u589e\u957f\u7387","xAxisIndex": 1,"yAxisIndex": 1,"symbolSize": 12,"data": [[6.68,0.0],[6.72,26.67],[6.79,71.58],[6.63,-50.92],[6.67,100.0],[6.72,25.0],[5.75,24.0],[6.96,-82.26],[6.95,-70.68],[5.9,310.85],[5.49,35.85],[5.5,13.89],[5.7,26.83],[5.67,-5.77],[5.71,11.22],[5.6,26.61],[7.39,177.54],[7.53,17.39],[7.07,18.1],[6.01,-66.29],[6.23,-38.55],[6.68,105.45],[6.59,-8.85],[6.71,5.34],[6.92,17.97],[7.1,25.39],[7.01,0.0],[7.01,11.21],[7.27,20.73],[7.72,-22.51],[8.27,44.91],[8.52,-38.22],[8.56,49.5],[9.13,33.33],[8.77,-0.5]],"label": {"show": false,"margin": 8,"valueAnimation": false}}],"legend": [{"data": ["92#\u6c7d\u6cb9\u4ef7\u683c(\u5143/\u5347)","\u65b0\u80fd\u6e90\u8f66\u9500\u91cf(\u4e07\u8f86)"],"selected": {},"show": true,"padding": 5,"itemGap": 10,"itemWidth": 25,"itemHeight": 14,"backgroundColor": "transparent","borderColor": "#ccc","borderRadius": 0,"pageButtonItemGap": 5,"pageButtonPosition": "end","pageFormatter": "{current}/{total}","pageIconColor": "#2f4554","pageIconInactiveColor": "#aaa","pageIconSize": 15,"animationDurationUpdate": 800,"selector": false,"selectorPosition": "auto","selectorItemGap": 7,"selectorButtonGap": 10},{"data": ["\u589e\u957f\u7387"],"selected": {},"show": true,"padding": 5,"itemGap": 10,"itemWidth": 25,"itemHeight": 14,"backgroundColor": "transparent","borderColor": "#ccc","borderRadius": 0,"pageButtonItemGap": 5,"pageButtonPosition": "end","pageFormatter": "{current}/{total}","pageIconColor": "#2f4554","pageIconInactiveColor": "#aaa","pageIconSize": 15,"animationDurationUpdate": 800,"selector": false,"selectorPosition": "auto","selectorItemGap": 7,"selectorButtonGap": 10}],"tooltip": {"show": true,"trigger": "item","triggerOn": "mousemove|click","axisPointer": {"type": "line"},"showContent": true,"alwaysShowContent": false,"showDelay": 0,"hideDelay": 100,"enterable": false,"confine": false,"appendToBody": false,"transitionDuration": 0.4,"textStyle": {"fontSize": 14},"borderWidth": 0,"padding": 5,"order": "seriesAsc"},"xAxis": [{"name": "\u65f6\u95f4","show": true,"scale": false,"nameLocation": "end","nameGap": 15,"gridIndex": 0,"axisLabel": {"show": true,"rotate": 45,"margin": 8,"valueAnimation": false},"inverse": false,"offset": 0,"splitNumber": 5,"minInterval": 0,"splitLine": {"show": true,"lineStyle": {"show": true,"width": 1,"opacity": 1,"curveness": 0,"type": "solid"}},"animation": true,"animationThreshold": 2000,"animationDuration": 1000,"animationEasing": "cubicOut","animationDelay": 0,"animationDurationUpdate": 300,"animationEasingUpdate": "cubicOut","animationDelayUpdate": 0,"data": ["2019\u5e7410\u6708","2019\u5e7411\u6708","2019\u5e7412\u6708","2019\u5e749\u6708","2020\u5e7410\u6708","2020\u5e7411\u6708","2020\u5e7412\u6708","2020\u5e741\u6708","2020\u5e742\u6708","2020\u5e743\u6708","2020\u5e744\u6708","2020\u5e745\u6708","2020\u5e746\u6708","2020\u5e747\u6708","2020\u5e748\u6708","2020\u5e749\u6708","2021\u5e7410\u6708","2021\u5e7411\u6708","2021\u5e7412\u6708","2021\u5e741\u6708","2021\u5e742\u6708","2021\u5e743\u6708","2021\u5e744\u6708","2021\u5e745\u6708","2021\u5e746\u6708","2021\u5e747\u6708","2021\u5e748\u6708","2021\u5e749\u6708","2022\u5e741\u6708","2022\u5e742\u6708","2022\u5e743\u6708","2022\u5e744\u6708","2022\u5e745\u6708","2022\u5e746\u6708","2022\u5e747\u6708"]},{"name": "\u6c7d\u6cb9\u4ef7\u683c(\u5143/\u5347)","show": true,"scale": false,"nameLocation": "end","nameGap": 15,"gridIndex": 1,"inverse": false,"offset": 0,"splitNumber": 5,"minInterval": 0,"splitLine": {"show": true,"lineStyle": {"show": true,"width": 1,"opacity": 1,"curveness": 0,"type": "solid"}},"animation": true,"animationThreshold": 2000,"animationDuration": 1000,"animationEasing": "cubicOut","animationDelay": 0,"animationDurationUpdate": 300,"animationEasingUpdate": "cubicOut","animationDelayUpdate": 0,"data": [6.68,6.72,6.79,6.63,6.67,6.72,5.75,6.96,6.95,5.9,5.49,5.5,5.7,5.67,5.71,5.6,7.39,7.53,7.07,6.01,6.23,6.68,6.59,6.71,6.92,7.1,7.01,7.01,7.27,7.72,8.27,8.52,8.56,9.13,8.77]}],"yAxis": [{"name": "\u6cb9\u4ef7(\u5143/\u5347)","show": true,"scale": false,"nameLocation": "end","nameGap": 15,"gridIndex": 0,"inverse": false,"offset": 0,"splitNumber": 5,"minInterval": 0,"splitLine": {"show": true,"lineStyle": {"show": true,"width": 1,"opacity": 1,"curveness": 0,"type": "solid"}},"animation": true,"animationThreshold": 2000,"animationDuration": 1000,"animationEasing": "cubicOut","animationDelay": 0,"animationDurationUpdate": 300,"animationEasingUpdate": "cubicOut","animationDelayUpdate": 0},{"type": "value","name": "\u9500\u91cf(\u4e07\u8f86)","show": true,"scale": false,"nameLocation": "end","nameGap": 15,"gridIndex": 0,"axisLine": {"show": true,"onZero": true,"onZeroAxisIndex": 0,"lineStyle": {"show": true,"width": 1,"opacity": 1,"curveness": 0,"type": "solid","color": "#5793f3"}},"inverse": false,"position": "right","offset": 0,"splitNumber": 5,"minInterval": 0,"splitLine": {"show": true,"lineStyle": {"show": true,"width": 1,"opacity": 1,"curveness": 0,"type": "solid"}},"animation": true,"animationThreshold": 2000,"animationDuration": 1000,"animationEasing": "cubicOut","animationDelay": 0,"animationDurationUpdate": 300,"animationEasingUpdate": "cubicOut","animationDelayUpdate": 0},{"name": "\u589e\u957f\u7387(%)","show": true,"scale": false,"nameLocation": "end","nameGap": 15,"gridIndex": 1,"axisLabel": {"show": true,"margin": 8,"formatter": "{value}%","valueAnimation": false},"inverse": false,"offset": 0,"splitNumber": 5,"minInterval": 0,"splitLine": {"show": true,"lineStyle": {"show": true,"width": 1,"opacity": 1,"curveness": 0,"type": "solid"}},"animation": true,"animationThreshold": 2000,"animationDuration": 1000,"animationEasing": "cubicOut","animationDelay": 0,"animationDurationUpdate": 300,"animationEasingUpdate": "cubicOut","animationDelayUpdate": 0}],"title": [{"show": true,"text": "\u6cb9\u4ef7\u4e0e\u65b0\u80fd\u6e90\u8f66\u9500\u91cf\u8d8b\u52bf\u5206\u6790","target": "blank","subtarget": "blank","top": "5%","padding": 5,"itemGap": 10,"textAlign": "auto","textVerticalAlign": "auto","triggerEvent": false},{"show": true,"target": "blank","subtarget": "blank","padding": 5,"itemGap": 10,"textAlign": "auto","textVerticalAlign": "auto","triggerEvent": false}],"dataZoom": [{"show": true,"type": "slider","showDetail": true,"showDataShadow": true,"realtime": true,"start": 20,"end": 80,"orient": "horizontal","zoomLock": false,"bottom": "15%","filterMode": "filter"},[{"show": true,"type": "slider","showDetail": true,"showDataShadow": true,"realtime": true,"start": 20,"end": 80,"orient": "horizontal","zoomLock": false,"bottom": "15%","filterMode": "filter"}]],"grid": [{"show": false,"zlevel": 0,"z": 2,"left": "10%","right": "10%","height": "60%","containLabel": false,"backgroundColor": "transparent","borderColor": "#ccc","borderWidth": 1,"shadowOffsetX": 0,"shadowOffsetY": 0},{"show": false,"zlevel": 0,"z": 2,"left": "10%","top": "75%","right": "10%","containLabel": false,"backgroundColor": "transparent","borderColor": "#ccc","borderWidth": 1,"shadowOffsetX": 0,"shadowOffsetY": 0}]
};chart_c11f1b5d33074118ac3ebbb30ff32fd5.setOption(option_c11f1b5d33074118ac3ebbb30ff32fd5);</script>
</body>
</html>
预览:
假如生成的 html 有三个或者多个,你需要将这三个或者多个 html 在一个 html 中展示,可以如下进行:
根据提示,代码已经完美运行,代码如下:
import pymysql
from pyecharts.charts import Line, Scatter
from pyecharts import options as opts# 数据库连接配置
config = {"host": "node01","port": 3306,"user": "root","password": "123456","database": "test_ai","charset": "utf8"
}# 连接数据库并获取数据
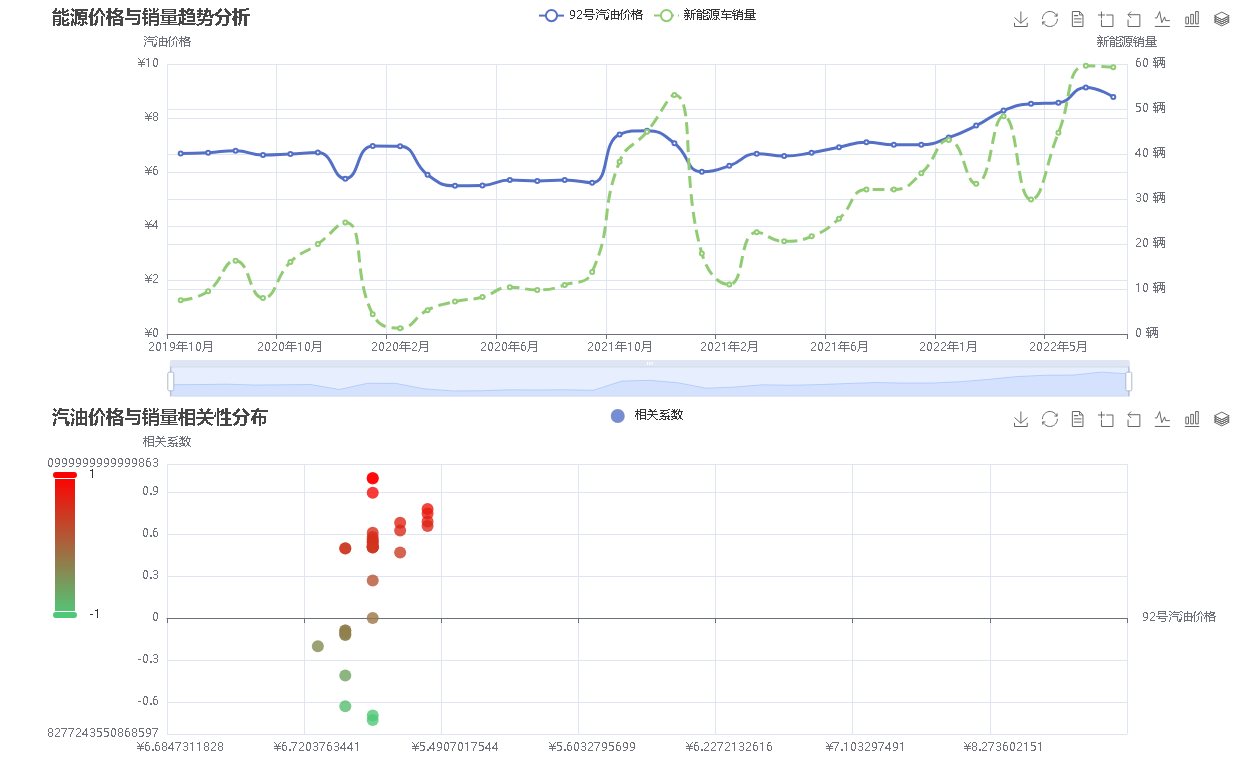
try:conn = pymysql.connect(**config)cursor = conn.cursor()cursor.execute("""SELECT month,COALESCE(gasoline_92, 0) AS gasoline_92,COALESCE(new_energy_vehicle_sales, 0) AS new_energy,COALESCE(price_sales_corr, 0) AS corrFROM a ORDER BY month""")data = cursor.fetchall()# 提取各列数据months = [row[0] for row in data]gasoline_92 = [float(row[1]) for row in data]new_energy = [float(row[2]) for row in data]corr_values = [float(row[3]) for row in data]finally:cursor.close()conn.close()# 图表1:燃油价格与新能源销量趋势图
line = (Line().add_xaxis(months).add_yaxis("92号汽油价格", gasoline_92,linestyle_opts=opts.LineStyleOpts(width=3),is_smooth=True).add_yaxis("新能源车销量", new_energy,linestyle_opts=opts.LineStyleOpts(width=3, type_="dashed"),is_smooth=True).set_global_opts(title_opts=opts.TitleOpts(title="能源价格与销量趋势分析"),tooltip_opts=opts.TooltipOpts(trigger="axis"),datazoom_opts=opts.DataZoomOpts(),yaxis_opts=opts.AxisOpts(name="数值范围",type_="value",axislabel_opts=opts.LabelOpts(formatter="{value}")))
)# 图表2:价格与销量的相关性分析
scatter = (Scatter().add_xaxis(gasoline_92).add_yaxis("相关系数", corr_values,symbol_size=12,label_opts=opts.LabelOpts(is_show=False)).set_global_opts(title_opts=opts.TitleOpts(title="汽油价格与销量相关性分布"),xaxis_opts=opts.AxisOpts(name="92号汽油价格"),yaxis_opts=opts.AxisOpts(name="相关系数"),tooltip_opts=opts.TooltipOpts(formatter="价格: {c}"),visualmap_opts=opts.VisualMapOpts(dimension=1,min_=min(corr_values),max_=max(corr_values),range_color=["#50C878", "#FF0000"]))
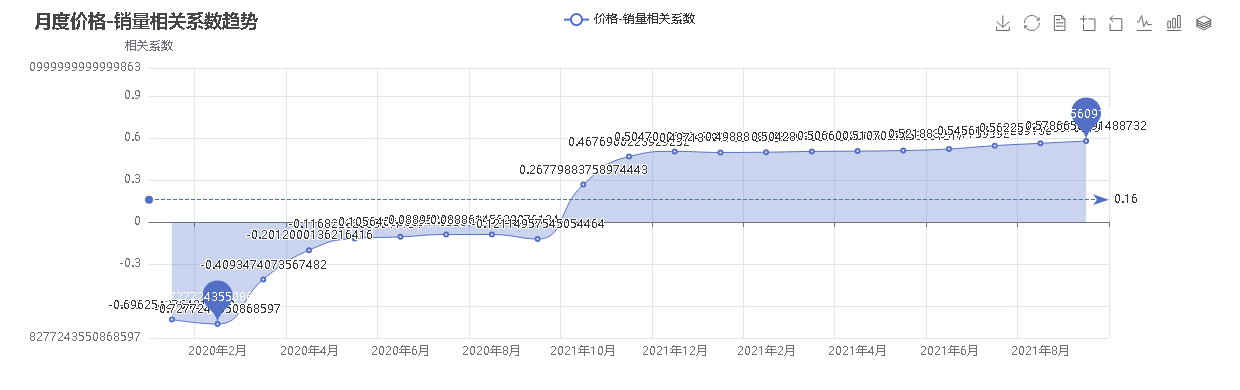
)# 图表3:价格-销量相关性趋势
corr_line = (Line().add_xaxis(months).add_yaxis("价格-销量相关系数", corr_values,is_smooth=True,areastyle_opts=opts.AreaStyleOpts(opacity=0.3),markpoint_opts=opts.MarkPointOpts(data=[opts.MarkPointItem(type_="max")])).set_global_opts(title_opts=opts.TitleOpts(title="月度价格-销量相关系数趋势"),yaxis_opts=opts.AxisOpts(name="相关系数"),tooltip_opts=opts.TooltipOpts(trigger="axis"))
)# 生成HTML文件
line.render("energy_trend.html")
scatter.render("price_correlation_scatter.html")
corr_line.render("correlation_trend.html")print("图表已生成:energy_trend.html, price_correlation_scatter.html, correlation_trend.html")但是目前生成的图表在三个html中,是否可以帮我合成一个html展示三个图表呢?


