线上问题的定位与优化
线上问题的定位与优化是日常工作中必不可少的事情,常见的问题定位手段有日志排查、、指标、分布式链路追踪和性能分析等,其中
- 日志排查主要用来定位业务逻辑问题,
- 指标、分布式链路主要用来定位请求链路中具体是哪个环节出了问题,
- 性能优化究竟应该怎么做
而如果服务本身的性能出了问题,如一段时间复杂度高的代码引发了CPU占比飙升、内存泄漏等,则需要依赖性能分析工具来帮我们定位此类问题。
Golang技术-pprof
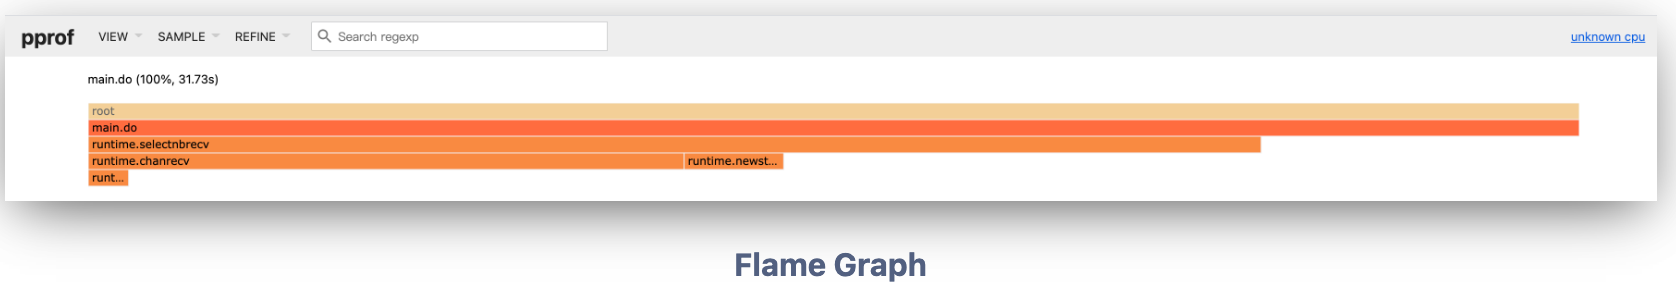
在Golang技术栈中,pprof则是性能分析的一大杀器,它可以帮助我们获取到程序的运行时现场(profile data),并以可视化的形式展示出来,火焰图是其中最为常见的一种展现形式:
- 我们如果想要借助pprof的能力进行性能分析,通常的步骤是:
- 程序中导入net/http/pprof包,并开放端口用于获取profile数据;
- 使用go tool中集成的pprof工具,访问端口下载profile数据,然后在本地对profile数据进行解析并可视化展示。
- 见分享:Golang 使用pprof
局限性
- 线上服务出现异常,发出告警,但是很快就恢复了,这个时候当我们再来看的时候,服务异常时候的现场已经丢失,如果遇到这种情况,我们该如何应对?
- 如何避免在线上Golang系统半夜宕机 (一般是OOM导致的)时起床保存现场呢?
- 又或者如何dump压测时性能尖刺时刻的profile文件呢?
因此可以说,仅仅凭借pprof提供的基础能力,我们很难应对在复杂的业务系统中突发的性能问题。
对pprof的使用改进
既然人为手动采集profile数据的方式不再适用,那就朝自动化的方向演进。对于自动采集profile 有两种方式
- 自动采集:在发生异常时自动采集 pprof,落地成本地文件,并且发出通知,这一解决方案代表有:holmes
- 采样采集:通过采样采集收集,再通过页面展示。这一解决方案有:pyroscope: 一个简单易用的持续剖析平台
holmes 原理剖析以及使用
holmes 每隔一段时间收集一次以下应用指标:
- 协程数,通过runtime.NumGoroutine。
- 当前应用所占用的RSS,通过gopsutil第三方库。
- CPU使用率,比如8C的机器,如果使用了4C,则使用率为50%,通过gopsutil第三方库。
- 局限性:默认情况下采集下来的profile数据存储在应用运行环境的磁盘上
- holmes 也可以通过实现Report 发送包含现场的告警信息,当holmes触发Dump操作时。将Profiles上传到其他地方,以防实例被销毁,从而导致profile丢失,或进行分析。
如何使用
import ("mosn.io/holmes"
)func main(){pprofHolmes()
}func pprofHolmes() {h := initHolmes()// start the metrics collect and dump looph.Start()// quit the application and stop the dumperh.Stop()
}
func initHolmes() *holmes.Holmes {h, _ := holmes.New(holmes.WithCollectInterval("5s"),holmes.WithDumpPath("/tmp"),holmes.WithCPUDump(20, 25, 80, time.Minute),holmes.WithCPUMax(90),)h.EnableCPUDump()return h
}
holmes 支持对以下几种应用指标进行监控:
- mem: 内存分配
- cpu: cpu使用率
- thread: 线程数
- goroutine: 协程数
- gcHeap: 基于GC周期的内存分配
Dump事件上报
以通过实现Reporter 来实现以下功能:
- 发送包含现场的告警信息,当holmes触发Dump操作时。
- 将Profiles上传到其他地方,以防实例被销毁,从而导致profile丢失,或进行分析。
func initHolmes() *holmes.Holmes {report := &ReporterImpl{}h, _ := holmes.New(holmes.WithProfileReporter(report),holmes.WithCollectInterval("5s"),holmes.WithDumpPath("/tmp"),holmes.WithCPUDump(20, 25, 80, time.Minute),holmes.WithCPUMax(90),)h.EnableCPUDump()return h
}type ReporterImpl struct{}func (r *ReporterImpl) Report(pType string, buf []byte, reason string, eventID string) error {return nil
}
原理分析
- Holmes 核心函数是定期收集系统资源使用情况,并根据配置的规则进行相应的性能分析和转储操作
初始化部分
// init previous cool down time
now := time.Now()
h.cpuCoolDownTime = now
h.memCoolDownTime = now
h.grCoolDownTime = now// init stats ring
h.cpuStats = newRing(minCollectCyclesBeforeDumpStart)
h.memStats = newRing(minCollectCyclesBeforeDumpStart)
h.grNumStats = newRing(minCollectCyclesBeforeDumpStart)
h.threadStats = newRing(minCollectCyclesBeforeDumpStart)
- 初始化冷却时间:将 CPU、内存和 goroutine 的冷却时间设置为当前时间。
- 初始化统计环:使用 newRing 函数创建 CPU、内存、goroutine
数量和线程数量的统计环,minCollectCyclesBeforeDumpStart - 定义了开始转储前需要收集的最小周期数。
定时循环部分
// dump loop
ticker := time.NewTicker(h.opts.CollectInterval)
defer ticker.Stop()for {select {case <-h.opts.intervalResetting:// wait for go version update to 1.15// can use Reset API directly here. pkg.go.dev/time#Ticker.Reset// we can't use the `for-range` here, because the range loop// caches the variable to be lopped and then it can't be overwrittenitv := h.opts.CollectIntervalh.Infof("[Holmes] collect interval is resetting to [%v]\n", itv) //nolint:forbidigoticker = time.NewTicker(itv)default:// bug fix: https://github.com/mosn/holmes/issues/63// make sure that the message inside intervalResetting channel// would be consumed before ticker.C.<-ticker.Cif atomic.LoadInt64(&h.stopped) == 1 {h.Infof("[Holmes] dump loop stopped") //nolint:forbidigoreturn}
- 创建一个 time.Ticker,按照 h.opts.CollectInterval 的时间间隔触发。
- 使用 select 语句监听 h.opts.intervalResetting 通道,如果接收到消息,说明收集间隔需要重置,创建一个新的 ticker。
- 如果没有收到重置消息,等待 ticker.C 通道的信号,表示一个收集周期结束。
- 检查 h.stopped 标志,如果为 1,表示循环已经停止,退出方法。
资源收集和检查部分
cpuCore, err := h.getCPUCore()
if cpuCore == 0 || err != nil {h.Errorf("[Holmes] get CPU core failed, CPU core: %v, error: %v", cpuCore, err)return
}memoryLimit, err := h.getMemoryLimit()
if memoryLimit == 0 || err != nil {h.Errorf("[Holmes] get memory limit failed, memory limit: %v, error: %v", memoryLimit, err)return
}cpu, mem, gNum, tNum, err := collect(cpuCore, memoryLimit)
if err != nil {h.Errorf("failed to collect resource usage: %v", err.Error())continue
}h.cpuStats.push(cpu)
h.memStats.push(mem)
h.grNumStats.push(gNum)
h.threadStats.push(tNum)h.collectCount++
if h.collectCount < minCollectCyclesBeforeDumpStart {// at least collect some cycles// before start to judge and dumph.Debugf("[Holmes] warming up cycle : %d", h.collectCount)continue
}
- 获取 CPU 核心数和内存限制。
- 调用 collect 函数收集 CPU、内存、goroutine 数量和线程数量的使用情况。
- 将收集到的数据添加到相应的统计环中。
- 增加收集计数 h.collectCount,如果计数小于 minCollectCyclesBeforeDumpStart,说明还在预热阶段,继续下一次循环。
转储检查和操作部分
if err := h.EnableDump(cpu); err != nil {h.Infof("[Holmes] unable to dump: %v", err)continue
}h.goroutineCheckAndDump(gNum)
h.memCheckAndDump(mem)
h.cpuCheckAndDump(cpu)
h.threadCheckAndDump(tNum)
h.threadCheckAndShrink(tNum)
- 调用 h.EnableDump 方法检查是否允许进行转储操作,如果不允许,记录日志并继续下一次循环。
- 依次调用 goroutineCheckAndDump、memCheckAndDump、cpuCheckAndDump、threadCheckAndDump 和 threadCheckAndShrink 方法,根据收集到的数据进行相应的检查和转储操作。
pyroscope 原理剖析以及使用
- Pyroscope是一个开源的持续分析系统,使用Go语言实现。服务端使用web页面查看,提供丰富的分析的功能,客户端提供Go、Java、Python、Ruby、PHP、.NET等多种语言的支持,并且支持PUSH、PULL两种采集方式。
- pyroscope是传统的CS架构,pyroscope客户端上报数据到pyroscope的服务端,服务端再通过可视化技术进行展示。

使用例子
package mainimport ("context"pyroscope "github.com/grafana/pyroscope-go""runtime/pprof"
)func main() {initGyroscope()pyroscope.TagWrapper(context.Background(), pyroscope.Labels("foo", "bar"), func(c context.Context) {for {fastFunction(c)slowFunction(c)}})
}/*** @Description: 初始化 pyroscope 监控*/
func initGyroscope() {_,err := pyroscope.Start(pyroscope.Config{ApplicationName: "test-v1.0.0",// replace this with the address of pyroscope serverServerAddress: "http://192.168.0.100:4040",// you can disable logging by setting this to nilLogger: nil,// by default all profilers are enabled,// but you can select the ones you want to use:ProfileTypes: []pyroscope.ProfileType{pyroscope.ProfileCPU,pyroscope.ProfileAllocObjects,pyroscope.ProfileAllocSpace,pyroscope.ProfileInuseObjects,pyroscope.ProfileInuseSpace,},})if err != nil {panic(err)}
}//go:noinline
func work(n int) {// revive:disable:empty-block this is fine because this is a example app, not real production codefor i := 0; i < n; i++ {}// revive:enable:empty-block
}func fastFunction(c context.Context) {pyroscope.TagWrapper(c, pyroscope.Labels("function", "fast"), func(c context.Context) {work(20000000)})
}func slowFunction(c context.Context) {// standard pprof.Do wrappers work as wellpprof.Do(c, pprof.Labels("function", "slow"), func(c context.Context) {work(80000000)})
}- 主要配置ApplicationName的名称,这个名称会显示在Pyroscope的服务端下拉框中。profile数据要发送到哪一个Pyroscope服务器上,你可以配置ServerAddress,以及通过ProfileTypes监控要监控的Profile项。
- 只需加上这几行启动程序后,你就可以在Pyroscope server的web界面上查看持续分析的数据了。
- 可以看到 Pyroscope 还可以对函数性能进行监控,这是非常方便的,在做性能分析的时候非常有用
type Config struct {ApplicationName   string // e.g backend.purchasesTags              map[string]stringServerAddress     string // e.g http://pyroscope.services.internal:4040BasicAuthUser     string // http basic auth userBasicAuthPassword string // http basic auth passwordTenantID          string // specify TenantId when using phlare multi-tenancyUploadRate        time.DurationLogger            LoggerProfileTypes      []ProfileTypeDisableGCRuns     bool // this will disable automatic runtime.GC runs between getting the heap profilesHTTPHeaders       map[string]string// Deprecated: the field will be removed in future releases.// Use BasicAuthUser and BasicAuthPassword instead.AuthToken string // specify this token when using pyroscope cloud// Deprecated: the field will be removed in future releases.// Use UploadRate instead.DisableAutomaticResets bool// Deprecated: the field will be removed in future releases.// DisableCumulativeMerge is ignored.DisableCumulativeMerge bool// Deprecated: the field will be removed in future releases.// SampleRate is set to 100 and is not configurable.SampleRate uint32
}func (ps *Session) Start() error {t := ps.truncatedTime()ps.reset(t, t)ps.wg.Add(1)go func() {defer ps.wg.Done()ps.takeSnapshots()}()if ps.isCPUEnabled() {ps.wg.Add(1)go func() {defer ps.wg.Done()ps.cpu.Start()}()}return nil
}func (ps *Session) takeSnapshots() {t := time.NewTicker(ps.uploadRate)defer t.Stop()for {select {case endTime := <-t.C:ps.reset(ps.startTime, endTime)case f := <-ps.flushCh:ps.reset(ps.startTime, ps.truncatedTime())_ = ps.cpu.Flush()ps.upstream.Flush()f.wg.Done()case <-ps.stopCh:if ps.isCPUEnabled() {ps.cpu.Stop()}return}}
}func (ps *Session) reset(startTime, endTime time.Time) {ps.logger.Debugf("profiling session reset %s", startTime.String())// first reset should not result in an uploadif !ps.startTime.IsZero() {ps.uploadData(startTime, endTime)}ps.startTime = endTime
}
pyroscope 的默认采样率是100%,然后通过start()方法中开启的另外一个协程的takeSnapshots()方法在不断循环调用reset()来上报数据。
总结
- 文章主要围绕线上问题定位与优化展开,重点介绍了在Golang技术栈中如何利用性能分析工具(如pprof)及其改进方案(holmes和pyroscope)来解决复杂的性能问题。
- pprof适用于基础性能分析,但手动操作限制了其在复杂场景中的应用。
- holmes和pyroscope通过自动化和持续采样弥补了这一不足,分别适用于异常现场捕获和长期性能监控。


